Figures & data
Figure 1. The Pharmacokinetics of Botryllamide G in Mice. The maximum soluble dose (13 mg/kg) of botryllamide G was administered to mice (n = 3 for each timepoint) via IV tail vein injection. Botryllamide G demonstrate biphasic elimination, which involves rapid distribution into tissues and a plasma exposure that quickly dropped below the in vitro IC50 of 6.9 µM. Error bars represent mean standard deviation.
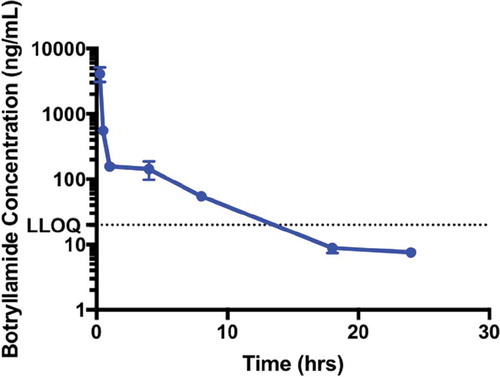
Figure 2. Lapatinib AUC in the brain of wild-type mice (n = 3 at each timepoint) when treated with lapatinib alone or in combination with botryllamide G (a) and exposure curve over 24 h. Lapatinib AUC in the plasma of wild-type mice (n = 3 at each timepoint) when treated with lapatinib alone or in combination with botryllamide G (b) and exposure curve over 24 h. Error bars represent mean standard deviation.
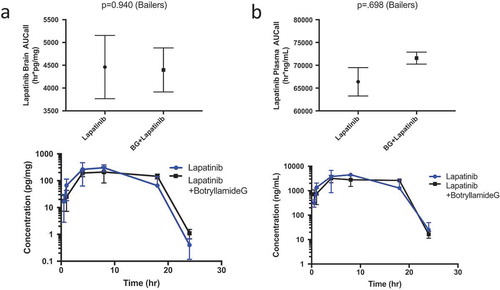
Figure 3. Lapatinib AUC in the brain of Mdr1a/Mdr1b knockout mice (n = 3 for each timepoint) when treated with lapatinib alone or in combination with botryllamide G (a) and exposure curve over 24 h. Lapatinib AUC in the plasma of wild-type mice (n = 3 for each timepoint) when treated with lapatinib alone or in combination with botryllamide G (b) and exposure curve over 24 h. Error bars represent mean standard deviation.
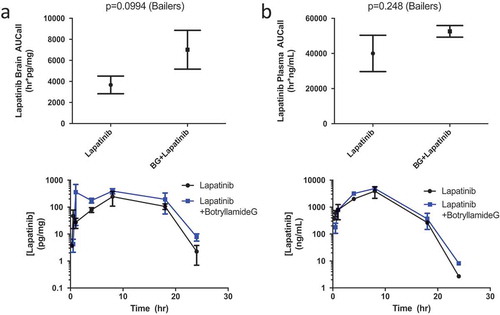
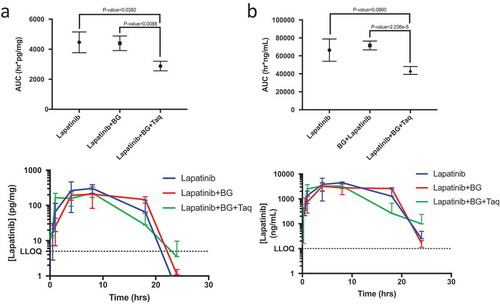
Figure 4. Lapatinib AUC in the brain of wild-type mice (n = 3 for each timepoint) when treated with lapatinib alone, in combination with botryllamide G alone, or botryllamide G and tariquidar (a) and exposure curve over 24 h. Lapatinib AUC in the plasma of wild-type mice (n = 3 for each timepoint) when treated with lapatinib alone, in combination with botryllamide G alone, or botryllamide G and tariquidar (b) and exposure curve over 24 h. Error bars represent mean standard deviation.