Figures & data
Figure 1. Loss of GUCA2A expression in tumors in human colorectum.
(a-c) GUCA2A protein quantified by (a-b) immunofluorescence or (c) immunoblot (a representative immunoblot is displayed) in adenocarcinomas (sporadic and FAP), adenomas, and normal mucosa. Where appropriate, matched normal adjacent tissues (NAT) and tumors from the same patient are highlighted with a connecting line. Corresponding H&E images (a) highlight histological changes associated with transformation. (d) GUCA2A mRNA quantified by RT-PCR in adenocarcinomas and matched normal mucosa (n = 17). (e) GUCA2A mRNA expression quantified by RNASeq in adenocarcinomas (n = 339) and normal mucosa (n = 51) from human colorectum from the TCGA database.Citation36 (f) GUCA2A mRNA quantified by RT-PCR in tubular adenomas (9) and normal mucosa (n = 8). (g) GUCA2A mRNA expression quantified by RNASeq in adenomas and matched normal mucosa (n = 32) from the human colorectum from a GEO dataset (accession number GSE8671).Citation37-Citation39 (h) GUCA2A mRNA quantified by RT-PCR analysis in FAP adenomas (n = 5) and normal mucosa (n = 6). Green, GUCA2A; blue, DAPI. *, p < .05; **, p < .01; ***, p < .001, ****, p < .0001. Scale bar = 100 µm.
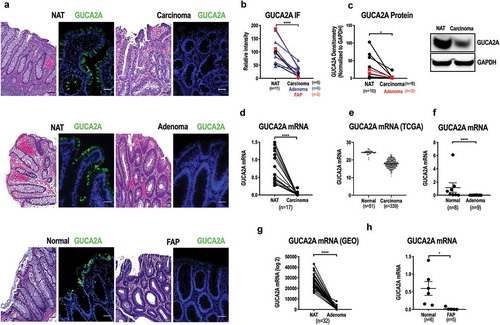
Figure 2. Retention of GUCY2C expression in tumors in human colorectum.
(a-c) GUCY2C protein quantified by (a-b) immunofluorescence or (c) immunoblot (canonical doublet at 140–160 kDa) in adenocarcinomas (sporadic and FAP) and adenomas and normal mucosa. Where appropriate, matched normal adjacent tissues (NAT) and tumors from the same patient are highlighted with a connecting line. (d) GUCY2C mRNA quantified by RT-PCR in adenocarcinomas and matched normal mucosa (n = 17). (e) GUCY2C mRNA quantified by RT-PCR analysis in tubular adenomas (n = 8) and normal mucosa (n = 9). (f) GUCY2C mRNA expression quantified by RNASeq in carcinomas (n = 339) and normal mucosa (n = 51) from human colorectum from the TCGA database.Citation36 (g) GUCY2C mRNA expression quantified by RNASeq in adenomas and matched normal mucosa (n = 32) from the human colorectum from a GEO dataset (accession number GSE8671).Citation37-Citation39 (h) GUCY2C mRNA quantified by RT-PCR analysis in FAP adenomas (n = 5) and normal mucosa (n = 6). Red, GUCY2C; blue, DAPI. ns, not significant. Scale bar = 100 µm.
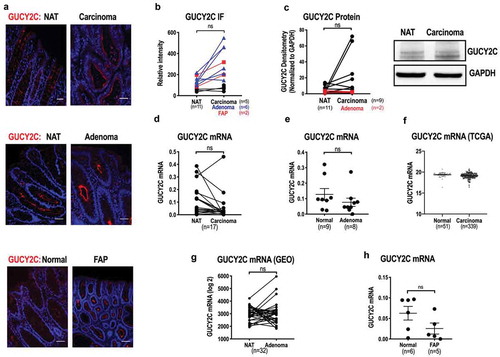
Figure 3. GUCA2A and GUCY2C in colonocytes following biallelic Apc in-activation in mice.
Wildtype (WT) and vil-Cre-ERT2-ApcCKO/CKO (CKO) mice received 100 mg/kg tamoxifen IP and colons with crypts were harvested 5 days later. (a) Immunblot analysis of APC, β-catenin and its downstream transcriptional targets. (b) Quantification of c-MYC and Axin2 mRNA by RT-PCR. (c) H&E and PCNA+ cell staining of colons from WT and CKO mice. (d) Immunoblot analysis of GUCA2A, GUCY2C, and their downstream signaling target, phosphorylated (P-)VASP. (e) Quantification of GUCA2A and GUCY2C mRNA by RT-PCR. (f) Immunofluorescence of GUCY2C (magenta), GUCA2A (green) and DAPI (blue) in colons from WT and CKO mice. ns, not significant; *, p < .05; ****, p < .0001. Scale bar = 100 µm.
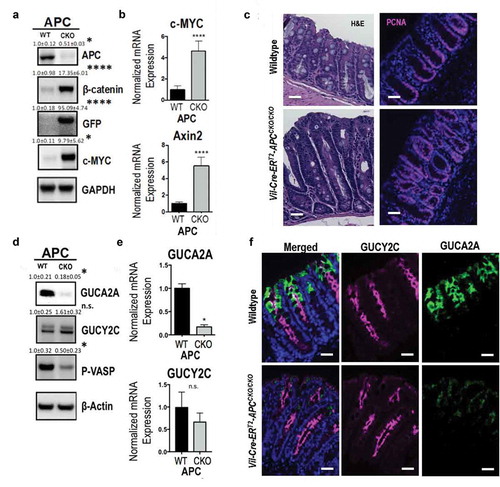
Figure 4. Regulation of GUCA2A expression by APC-β-catenin-TCF signaling in human colon cancer cells.
(a-b) HT29 cells carrying a transgene containing wildtype APC under a zinc-inducible promoterCitation43 and treated with 300 μM zinc express wild type APC, with an associated loss of β-catenin, in a time-dependent fashion. (c) Induction of wildtype APC reduced (red) downstream transcriptional targets upregulated by β-catenin-TCF signaling and increased (green) transcriptional targets downregulated by β-catenin-TCF signaling. (D-E) Wildtype APC induced expression of GUCA2A (d) mRNA and (e) protein. (f-g) A transgene containing an siRNA to β-catenin under the control of a doxycycline-inducible promoter in LS174T cellsCitation10,Citation44 suppressed the accumulation of β-catenin when treated with 1 μg/mL doxycycline. (h) Suppression of β-catenin reduced (red) downstream transcriptional targets upregulated by β-catenin-TCF signaling and increased (green) transcriptional targets downregulated by β-catenin-TCF signaling. (i-j) Suppression of β-catenin induced expression of GUCA2A (i) mRNA and (j) protein. (k-l) A transgene containing DNTCF under the control of a doxycycline-inducible promoter in DLD1 cellsCitation10,Citation44 inhibited TCF activity when treated with 1 μg/mL doxycycline. (m) Induction of DNTCF reduced (red) downstream transcriptional targets upregulated by β-catenin-TCF signaling and increased (green) transcriptional targets downregulated by β-catenin-TCF signaling. (N-O) DNTCF induced expression of GUCA2A (n) mRNA and (o) protein. (c, h, m) Gene expression normalized to non-induced cells and transformed to a log2 scale. *, p < .05; **, p < .01; ***, p < .001; ****, p < .0001.
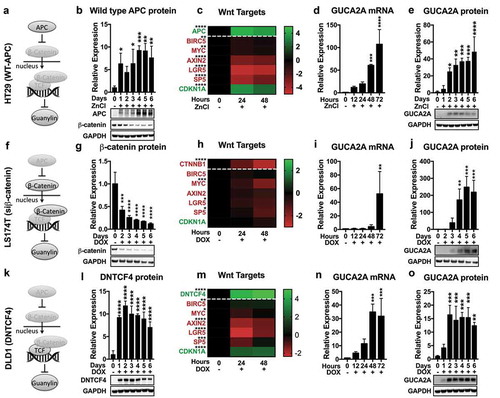
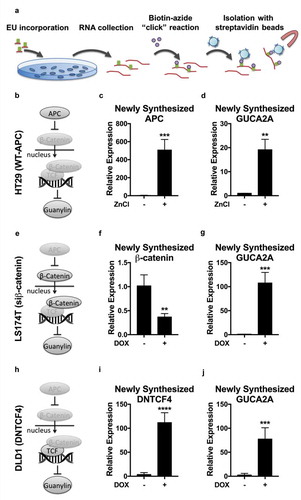
Figure 5. APC-β-catenin-TCF signaling suppresses the expression of new guanylin mRNA transcripts.
(a) Schematic shows EU-incorporation into newly synthesized RNA, biotinylation by click-chemistry, and isolation with magnetic streptavidin beads. (b-d) Treatment with 300 μM zinc of HT29 cells carrying a transgene containing wild type APC under a zinc-inducible promoterCitation43 induced the accumulation of nascent guanylin mRNA transcripts labeled with EU. (e-g) Treatment with 1 μg/mL doxycycline of LS174T cells carrying a transgene containing an siRNA to β-catenin under the control of a doxycycline-inducible promoterCitation10,Citation44 induced the accumulation of nascent guanylin mRNA transcripts labeled with EU. (h-i) Treatment with 1 μg/mL doxycycline of DLD1 cells carrying a transgene containing DNTCF under the control of a doxycycline-inducible promoterCitation10,Citation44 induced the accumulation of nascent guanylin mRNA transcripts labeled with EU. **, p < .01; ***, p < .001; ****, p < .0001.