
Figures & data
Figure 1. (a) Unsupervised hierarchical clustering analysis of the differentially expressed mRNAs between CD133- and CD133+ Caco-2 cells. (b) The differentially expressed genes between CRC and normal tissues, in which red indicates high expression, and green indicates low expression.
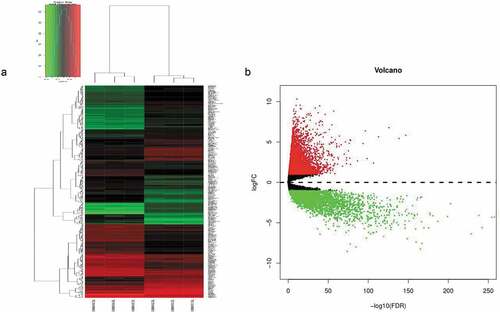
Table 1. Summary of colorectal cancer patient clinical characteristics based on the inclusion criteria.
Table 2. Enrichment analysis of GO terms for the 155 differentially expressed genes.
Figure 2. Acquisition of 155 differentially expressed genes and GO and KEGG functional enrichment analyses. (a) There were 393 differentially expressed genes between CD133- and CD133+ Caco-2 cells, 11,832 genes differentially expressed between colorectal tumor and normal tissues, and 155 genes coexisted among them. (b) GO functional enrichment and (c) KEGG pathway analyses of these 155 genes.
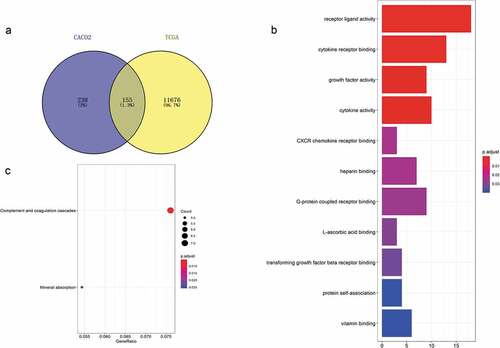
Figure 3. (a) Protein association networks of 155 genes. (b) The top 30 genes with the highest degree of correlation.
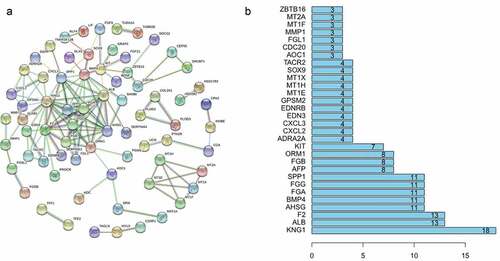
Figure 4. Genes associated with patient’s survival outcomes by applying the K-M method in “survival” R package.
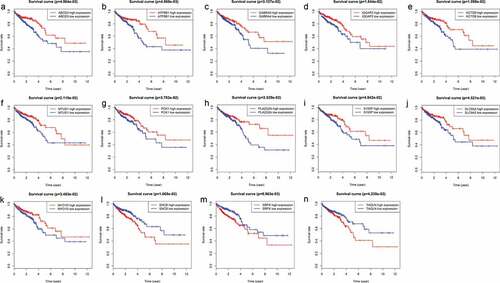
Table 3. Overall information of 9 prognostic mRNAs associated with OS in CRC patient.
Figure 5. (a) Distribution of mRNA-related RSs in patients. (b) The expression heatmap of nine prognostic mRNAs. (c) The mortality of patients with an increase in the RS. (d) K-M survival curve analysis for the OS of CRC patients using the nine-mRNA signature. (e) ROC curve analysis of the nine-mRNA signature.
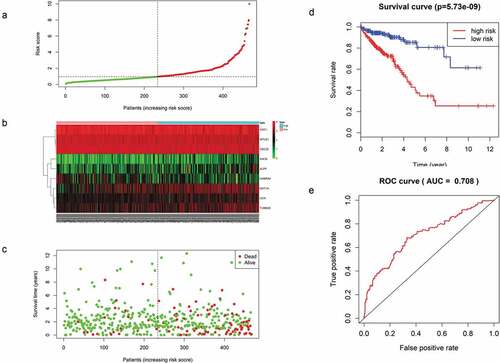
Table 4. Multivariate Cox regression analysis of overall survival.
Figure 6. (A ~ F) Patients divided according to the pathological stages of the tumor or age and analyzed for differences in the corresponding survival based on the signature.
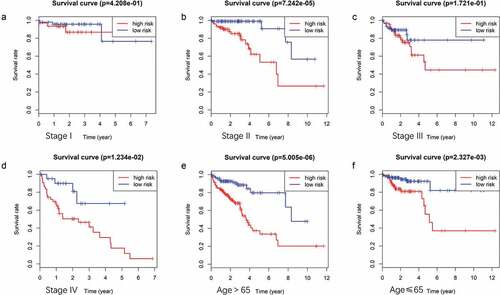
Figure 7. The survival difference of stage IIA and stage IVA between high and low risk groups of CRC patients.
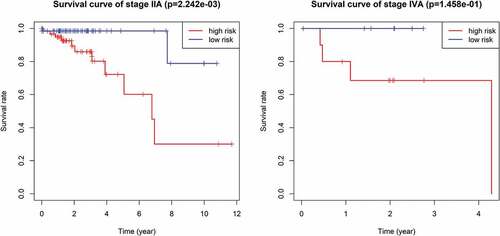
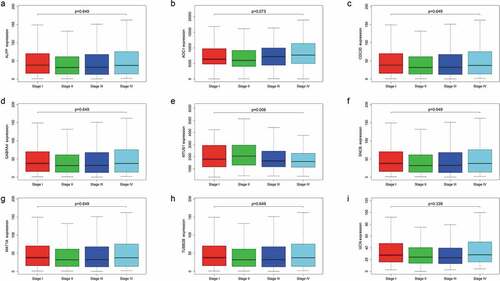
Figure 8. Expression levels of the nine mRNAs across four colorectal cancer subtypes.
Supplemental Material
Download Zip (3.4 MB)Availability of data and materials
The data that support the findings of this study are openly available in the TCGA Research Network: http://cancergenome.nih.gov/ and GEO database: https://www.ncbi.nlm.nih.gov/geo/. Also can be availabled from the corresponding author upon reasonable request.