Figures & data
Figure 1. Identification and biological function annotation of thyroid cancer associated DEGs. (a-c) Expression of radiation signature in sporadic and radiation-exposed PTC from GSE29265, GSE33630, and combined dataset. (d-e) Consistently up- and down-regulated DEGs in ATC and PTC by comparing to normal thyroid tissues. (f-g) GO Biological Process annotation of up- and down-regulated DEGs, respectively. Top ten significantly enriched GO terms with lowest q value were plotted. (h-i) Pathway enrichment of up- and down-regulated DEGs by Kyoto Encyclopedia of Genes and Genomes (KEGG), respectively. Top ten significantly enriched pathways with lowest q value were plotted.
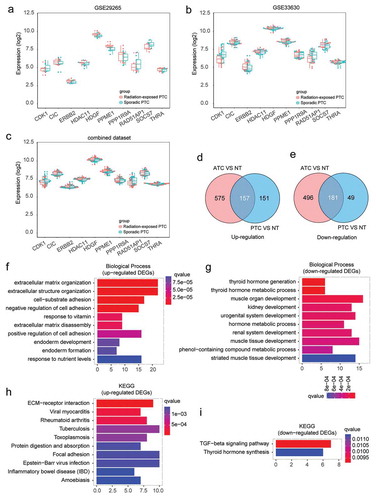
Figure 2. Identification of ATC-specific malignant signatures. (a) Intersection of consistently up-regulated DEGs in ATC as compared with normal thyroid tissues or PTC. (b) Intersection of consistently down-regulated DEGs in ATC as compared with normal thyroid tissues or PTC. (c) Heatmap of top 10 up and down-regulated DEGs in ATC.
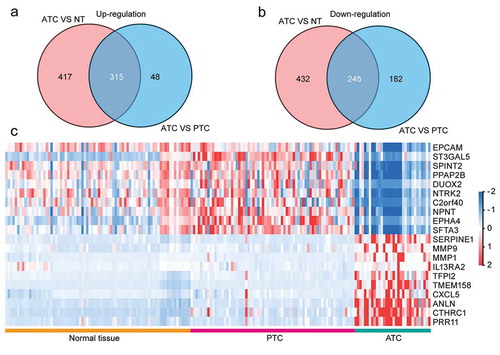
Figure 3. Gene Set Enrichment Analysis (GSEA) of ATC-specific DEGs. (a) The top 20 gene sets that positively or negatively correlated with ATC. (b-f) Enrichment plot of top 5 enriched gene sets that up-regulated in PTC. (g-k) Enrichment plot of top 5 enriched gene sets that up-regulated in ATC. NES, normalized enrichment score.
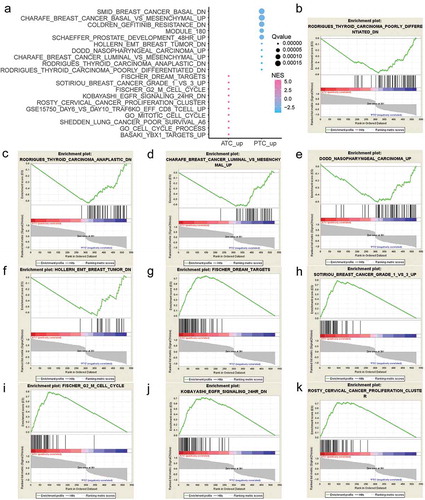
Figure 4. The protein-protein interaction network of ATC-specific DEGs. The PPI network was constructed by STRING and visualized by Cytoscape. Red nodes represented up-regulated DEGs. Blue nodes represented down-regulated DEGs.
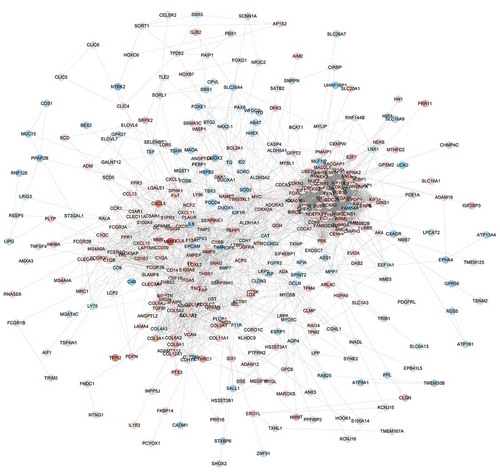
Figure 5. Module analysis of PPI network and gene function annotation. (a, c, e) Three most scored Modules in the PPI network were identified by MCODE algorithm. (b, d, f) Gene enrichment of Modules and construction of pathway interaction network were analyzed by GO (biological process) and KEGG in ClueGO.
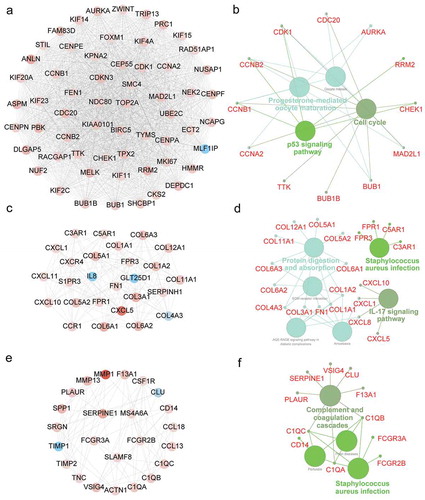
Figure 6. Identification of master regulators in regulatory network of ATC-specific modules. (a-c) Results of the regulatory analysis with iRegulon on three most scored modules. The red nodes represented regulated targets. The blue node was regulator and/or regulated target. The light cyan nodes indicated transcription factors.
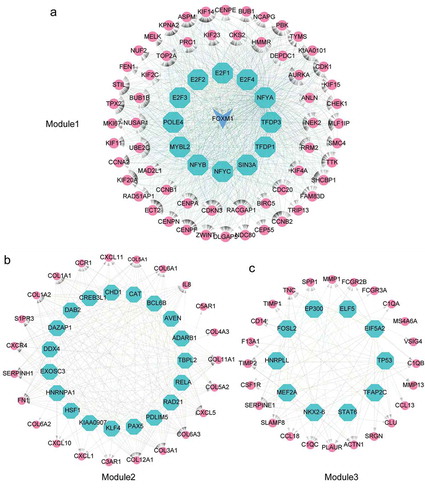
Figure 7. Correlation analysis of master regulators and three modules. (a, c, e) Pearson correlation analysis of TFs and modules. (b, d, f) The expression profile of TFs with Pearson r > 0.5 or < −0.5 were queried from microarray dataset. Results were showed as means ± SD in each group. * P < .05, ** P < .01, *** P < .001.
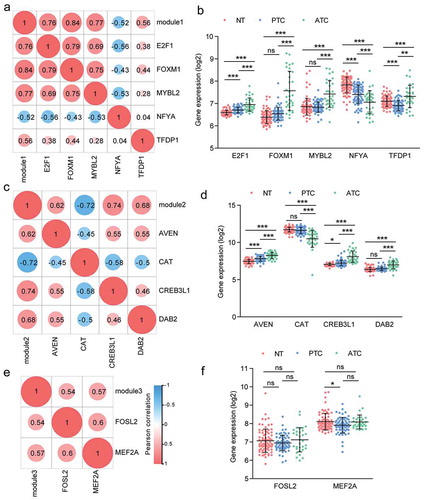
Figure 8. Identification of ATC-specific kinases and the phosphosite markers. (a) Heatmap of 19 featured kinases with expression values in different thyroid samples. (b) Phospho-target and the sequence logo of up-regulated protein kinases were listed.
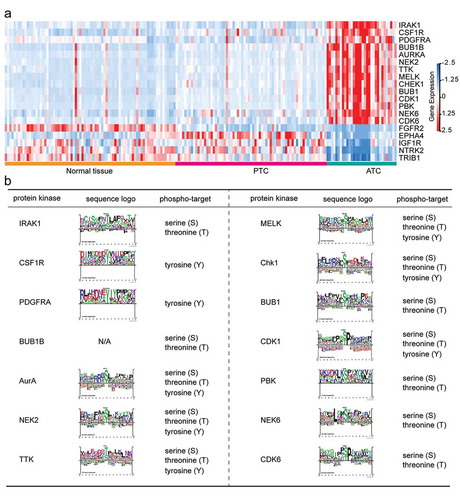
Figure 9. Experimental validation of candidate master regulators and construction of kinase-TFs interaction network. (a-i) The expression level of candidate master regulators was determined by RT-PCR. The sample numbers of each group were 6 normal thyroid tissues, 6 PTC and 3 ATC, respectively. NT, normal thyroid tissues. * P < .05, ** P < .01, *** P < .001. (j) Western blot analysis of candidate master regulators in Nthy-ori 3–1 (human thyroid follicular epithelial cell line), BCPAP (PTC cell line), and 8505 C (ATC cell line). (k) The PPI network of kinases and TFs. Red nodes indicated TFs, cyan nodes indicated protein kinases. TFs, transcription factors.
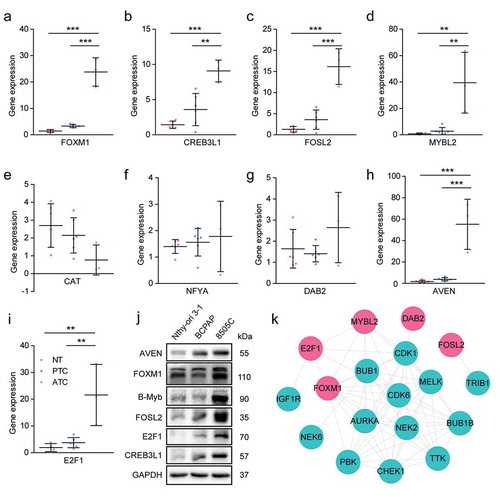
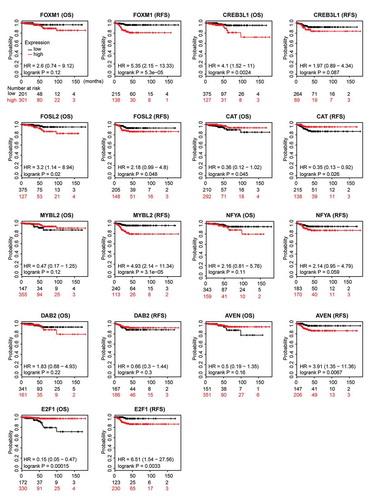
Figure 10. Prognostic relevance of nine ATC-specific master regulators in thyroid cancer. Overall survival (OS) and recurrence-free survival (RFS) of nine ATC-specific master regulators in thyroid cancer were retrieved from Kaplan-Meier plotter. Curves stratified by expression of FOXM1, CREB3L1, FOSL2, CAT, MYBL2, NFYA, DAB2, AVEN, and E2F1, respectively. Patients were split into low-expression group and high-expression group, according to the expression of nine genes above. Log-rank test was used to evaluate significance.