
Figures & data
Figure 1. Overview of sample selection, and correlations between DNAm age and chronological age. (a) The pie chart shows the proportion of normal samples and tumor samples at different stage. A total of 24 (6%) tumor samples without available stage information are labeled as “N/A,” (b) DNAm age of 50 normal hepatic samples can predict chronological age with decent correlation coefficient, whereas such correlation descended largely in either entire TCGA tumor cohort of 370 samples (red or pink dots) or early stage tumors with 256 samples (pink dots). The top and right marginal rug line describes the distribution of chronological age and DNAm age, respectively
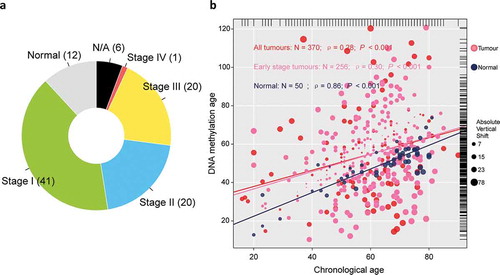
Figure 2. Construction of , and its association with DNAm age or epigenetic age acceleration. (a) Barplot demonstrates that the first and second principal components covered almost all the variations with a summing percentage of 95.1%. Significant negative correlations between
and either DNAm age or epigenetic age acceleration are shown in (b) and (c), respectively
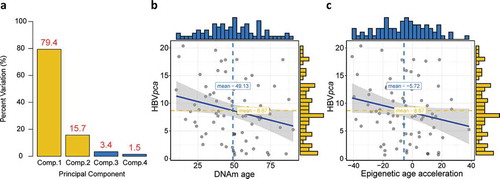
Figure 3. Cooccurrence of epigenetic age acceleration and immunoactivation as well as hypermethylation. (a) Volcano plot of differentially expressed genes for DNAmAge-ACC group against DNAmAge-DEC group with 117 upregulated and 201 down-regulated genes. GSEA identified upregulated (b) lymphocyte-related pathways and (c) immune response signaling pathways. GSEA further identified upregulated (d) other pathways related to immunoactivation for DNAmAge-ACC group; whereas (e) BMP signaling pathway, serine/threonine kinase signaling pathway and Wnt signaling pathway for DNAmAge-DEC group. (f) A total of 89 stringent hypermethylated probes were identified for DNAmAge-ACC group. The heatmap based on DNA methylation M values demonstrates a cooccurrence of epigenetic age acceleration and CpG island hypermethylation. For the averaged methylation level per sample, mean methylation β value was calculated for each sample (per column); for the averaged methylation level per probe, mean methylation β value per probe was calculated for DNAmAge-ACC and DNAmAge-DEC groups (per row), respectively. (g) Significant positive correlation between epigenetic age acceleration and averaged methylation level (M values)
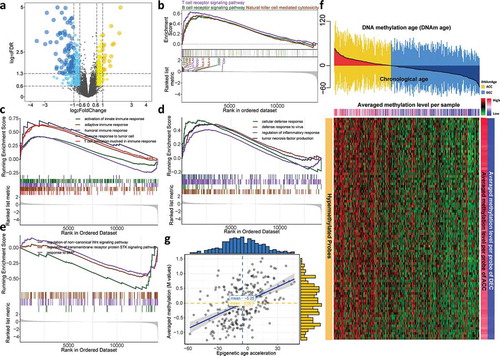
Figure 4. Mutation landscape of two DNAm age groups. (a) Violin plot shows lower tumor mutation burden in DNAmAge-ACC group as compared to DNAmAge-DEC group. (b) Mutational oncoprint depicts differential mutated genes for two DNAm age groups, including fisher’s exact test-based independent mutated genes and significantly mutated genes (SMGs) identified by MutSigCV algorithm. Common and group-specific SMGs under either stringent (q < 0.05) and loose (P < .05) criteria of MutSigCV algorithm were displayed by Venn diagrams in (c) and (d), respectively. Representation factor (RF) and the associated probability were calculated to infer the statistical significance of the overlap between two groups of genes where a RF < 1 indicates less overlap than expected of two independent groups
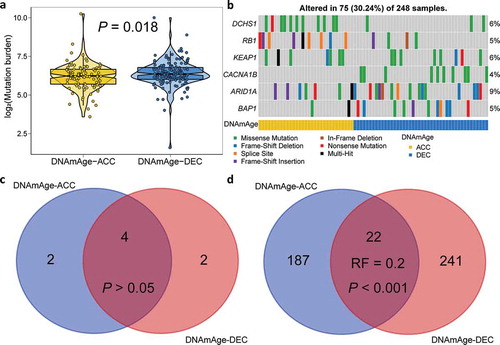
Table 1. Association of overall survival with epigenetic age acceleration for hepatocellular carcinoma in early stage
Figure 5. Prognostic value of epigenetic age acceleration in early stage HCC. (a) Kaplan-Meier curve with log-rank test demonstrates that patients belonging to DNAmAge-ACC showed significantly favorable prognosis regarding overall survival (OS). (b) Epigenetic age acceleration was further discretized into quartiles: Q1 (−58.0, −18.0), Q2 (−18.0, −5.7), Q3 (−5.7, 7.3), Q4 (7.3, 46.9), and rates of (b) OS also well-distinguished. (c) The association between epigenetic age acceleration and the fatality risk of early stage HCC when adjusted for chronological age (binary) and tumor stage was presented with cubic spline graph of the adjusted HR (solid red line) and 95% CI (dotted black line). Knots: −29.4 (10th), −5.7 (50th), and 18.9 (90th) of the distribution of epigenetic age acceleration; reference value: 0, which means that DNAm age equals to chronological age
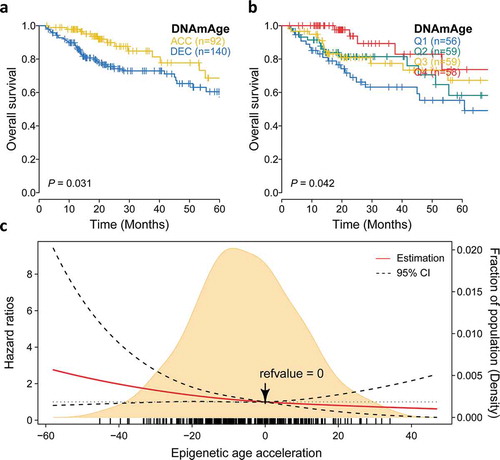
Table 2. Demographic and clinicopathological characteristics and the associations with DNAm age for 256 patients diagnosed with early stage hepatocellular carcinoma
Table 3. The coefficients of four HBV oncoproteins to the first and second principal components