Figures & data
Figure 1. The expression of miR-221-3p in liver tissues and cell lines. (a) The expression of miR-221-3p was detected in the tumorous, adjacent, and normal liver tissues using RT-qPCR. (b) The expression of miR-221-3p was detected in HL-7702, BEL-7404, SMMC-7721, Huh-7, and Hep G2 cell lines using RT-qPCR. HL-7702 was the normal cell line. * p < .05 and ** p < .001, compared with HL-7702 cell line. (c) The overall survival results of HCC patients divided by miR-221-3p level. The survival curve comparing the patients with high (n = 184) and low (n = 185) expression of miR-221-3p in HCC was plotted using StarBase pan-cancer data. Data represented the mean ± SD of three independent experiments. Log-rank p = .053
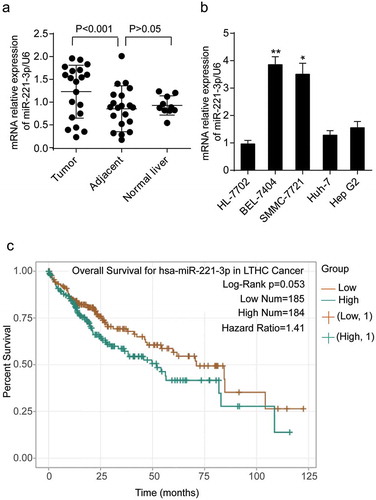
Figure 2. The effects of miR-221-3p on viability, migration, invasion, and proliferation in SMMC-7721 and BEL-7404 cell lines. (a) The cell viability was detected by MTT assay after transfection with miR-221-3p mimic, miR-221-3p inhibitor, negative control RNA for continuing five days. All the OD values were read at 490 nm. (b) Wound healing assay was used to assess the effect of miR-221-3p on migration rate. SMMC-7721 and BEL-7404 cells were transfected with miR-221-3p mimic, miR-221-3p inhibitor, and negative control RNA. Migration rate was defined as the ratio of migrating distance at 24 h to cell spacing at 0 h. (c) The ability of invasion was detected by transwell assay in SMMC-7721 and BEL-7404 cells in different groups. SMMC-7721 and BEL-7404 cells were transfected, as stated in Methods. The X-axis represents different groups depending on the transfection reagents, and the Y-axis represents the invasion cell number. (d) Colony foci formation results of transfected SMMC-7721 and BEL-7404 cells. The X-axis represents different groups, and the Y-axis represents the number of clones. All the bars in the figure represent mean ± SD from three independent experiments. * p < .05 and ** p < .001, compared with con (blank control) group
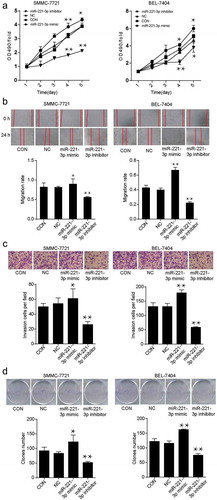
Figure 3. The effects of miR-221-3p on apoptosis and cell cycle in SMMC-7721 and BEL-7404 cells. (a) Flow cytometric assay was conducted to detect cell apoptosis after the transfection of SMMC-7721 and BEL-7404 cells with miR-221-3p mimic, miR-221-3p inhibitor, and negative control RNA. (b) The cell cycle was measured using the flow cytometric assay. The SMMC-7721 and BEL-7404 cells were transfected with the same molecules as mentioned above. The bars come from three independent experiments. Values are mean ± SD. * p < .05 and ** p < .001, compared with CON (blank control) group
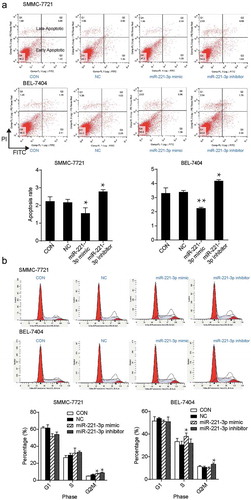
Figure 4. MGMT was the target of miR-221-3p and it’s down-regulated in HCC tissues and cells. (a) The targeting relationship between miR-221-3p and MGMT mRNA was predicted through RNA hybrid, microRNA, Pictar, and TargetScan. The binding scheme was illustrated. (b) The information of GV272 vector that was used to build GV272-MGMT or GV272-MGMT-Mut vectors for transfection in 293 T cell line. The relative luciferase activity was measured using a dual luciferase reporter gene assay. The 293 T cells were co-transfected with pRL-TK vectors containing Renilla luciferase and 0.4 μg of the miR-221-3p mimic or negative control (NC). (c) The immunohistochemical staining was used to measure the expression of MGMT protein in the tumors, adjacent liver tissues, and normal liver tissues. The positive percentage equals the ratio of positive cases to total cases. -: negative; +: positive. (d) The expression of MGMT mRNA was detected by RT-qPCR in SMMC-7721 and BEL-7404 cells transfected with miR-221-3p mimic, miR-221-3p inhibitor, negative control RNA. The bars represent mean ± SD of mRNA relative expression from three independent qPCR experiments. * p < .05 and ** p < .001, compared with CON (blank control) group. (e) The expression of MGMT protein was detected using western blot. In SMMC-7721 and BEL-7404 cells after transfection with miR-221-3p mimic, miR-221-3p inhibitor, and negative control RNA. (f) The expressions of MGMT at different stages of HCC was plotted using GEPIA data (an online gene profiling analysis tool). (g) The overall survival for MGMT in HCC patients. The survival curve comparing the patients with high and low expression of MGMT in HCC was also plotted using GEPIA. Log-rank p = .0021
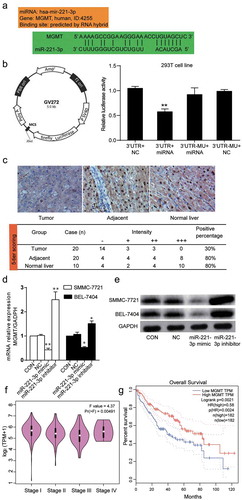
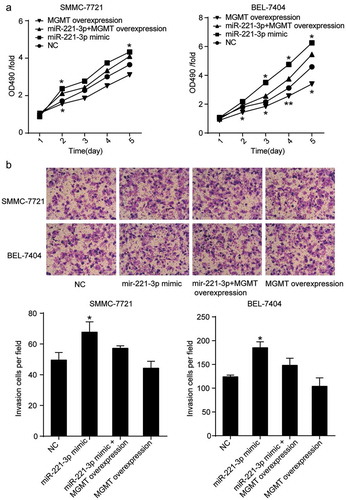
Figure 5. MGMT overexpression attenuated the effect of miR-221-3p on cell viability, and invasion in HCC cells. (a) MGMT overexpression was proved to inhibit HCC cell viability induced by miR-221-3p. Herein, the MTT assay was again employed to assess whether the forced overexpression of MGMT could influence miR-221-3p mediated increase of cell viability. (b) The MGMT overexpression restored the effect of miR-221-3p mimic on the invasion of SMMC-7721 and BEL-7404 cells. All the data represent mean ± SD from three independent experiments. Compared with the NC (negative control) group, * p < .05, and ** p < .001