Figures & data
Table 1. Comparison and evaluation of the clinical parameters of TANs classification in PDAC patients
Figure 1. Evaluation criteria of TANs for PDAC: figure A, C, E and G were immunohistochemistry (CD15) (20 × 100) of TANs, respectively. The same rows of B, D, F and H were the results of HE in the PDAC tissue of the same patient. Figures C and D were enlarged as the typical TANs. Plot of metastasis-free survival (i) and overall survival (j) for all patients stratified based upon TAN groups. Abbreviations: TAN tumor-associated neutrophils
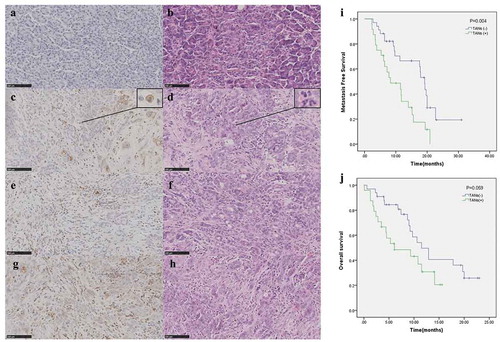
Figure 2. CCK8 test. PDAC cells (panc-1, miapaca-2, aspc-1 cells, 4 × 10⁶) were cocultured with neutrophils (1 × 10⁹) after 12 h of seeding (equal PDAC cells seeded first, neutrophils and lymphocytes were added after 12 h; therefore, the OD value showed a difference at 12 h). Compared with lymphocytes (1 × 10⁹) and the monoculture group, neutrophils show a lethal effect on PDAC cells
Figure 3. In vitro wound-healing assay of three PDAC cells (Panc-1, MiaPaCa-2, AsPC-1) cocultured with neutrophils and without (controls) at 0 h (Panc-1: photo after neutrophils added; MiaPaCa-2 and AsPC-1 photo before neutrophils added), 24 h and 48 h, respectively. As shown in the figure, neutrophils can promote the migration of all three PDAC cells (Panc-1, MiaPaCa-2, AsPC-1)
Figure 4. Transwell invasion experiments of Panc-1, Miapaca-2 and Aspc-1 cells separately cultured (Mo, Monoculture, FIG. ADG), indirectly cocultured with neutrophils (In, FIG. BEH) and directly cocultured (Di, Direct coculture, FIG. CFI). Compared with the monoculture, both indirect and direct co-culture with neutrophils increased the transmigration of all three PDAC cell lines significantly (JKL) (* P < .05; ** P < .01; ***P < .001)
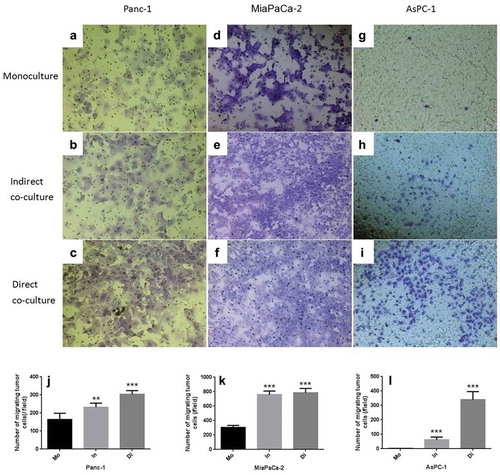
Figure 5. Expression of E-cadherin in three PDAC cells (Panc-1, MiaPaCa-2 and AsPC-1) was significantly reduced when direct cocultured (Di) or indirect cocultured (In) with neutrophils compared with that monocultured (Mo), while vimentin was significantly increased. The expression of E-cadherin and vimentin in Panc-1 at A and B, MiaPaCa-2 at C and D for AsPC-1 at E and F. To make each group comparable, the fluorescence brightness of the nucleus was set at the same level in the laser confocal imaging of the three groups. Vimentin (expressed in the cell membrane) was highly expressed in the indirect culture group in MiaPaCa-2, resulting in a higher brightness, so that it could not be distinguished in the image whether the expression site was the cell membrane or the nucleus. (* P < .05; ** P < .01; *** P < .001)
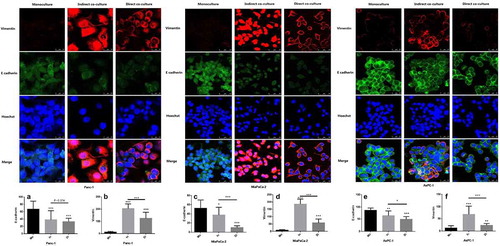
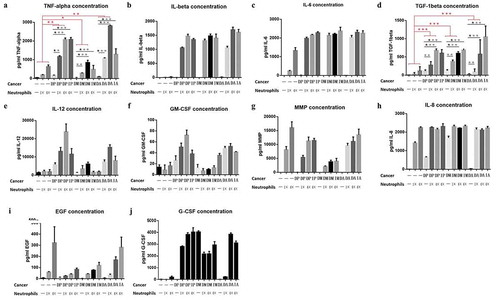
Figure 6. Detection of cytokines in three groups of cell lines (P: Panc-1, M:Miapaca-2, A:Aspc-1) in culture medium. (D: directly cocultured with neutrophils) and (In: indirectly cocultured with neutrophils). Detection of the concentrations of TNF-alpha, IL-6, TGF-beta, IL-12, GM-CSF, MMP, IL-8, EGF and G-CSF in cell culture medium (Fig A, B, C, D, E, F, G, H, I and J, respectively). Among all the cytokines, only TNF-α and TGF-β concurred with the experimental hypothesis: secreted by neutrophils, especially when stimulated by pancreatic cancer cells (1. the secretion of the cytokines was significantly increased in the coculture system; 2. their secretion was positively proportional to the concentration of neutrophils). (* P < .05; ** P < .01; ***P < .001)