Figures & data
![](/cms/asset/1afc930c-ab5d-4cb3-be75-2b11166c1e82/kcbt_a_1809912_uf0001_oc.jpg)
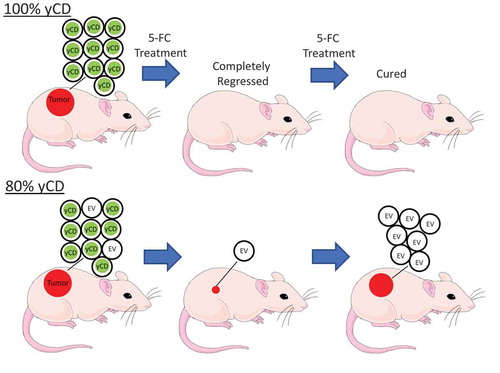
Table 1. 5-FU concentration after incubation with EV or yCD cells
Figure 1. yCD +5-FC conditioned media toxicity testing. EV or yCD cells were fed with media with or without 5-FC and conditioned media collected. The cells were treated with the various undiluted conditioned media (12 replicate wells) and viable cells detected using CellTiter-Glo® (ATP quantification) luminescent cell viability assay. Cell toxicity was compared to complete media. ****: p < .0001
![Figure 1. yCD +5-FC conditioned media toxicity testing. EV or yCD cells were fed with media with or without 5-FC and conditioned media collected. The cells were treated with the various undiluted conditioned media (12 replicate wells) and viable cells detected using CellTiter-Glo® (ATP quantification) luminescent cell viability assay. Cell toxicity was compared to complete media. ****: p < .0001](/cms/asset/2b61f89d-2203-46da-bd53-6fd1701369b1/kcbt_a_1809912_f0001_b.gif)
Figure 2. Chemosensitivity in 2D (a) and 3D (b) culture. yCD and EV cells were mixed at various ratios respectively, 100%/0%, 80%/20%, 60%/40%, 40%/60%, 20%/80%, 0%/100%. Cells were treated with at increasing doses of 5-FC for 6 days, and viable cells detected using CellTiter-Glo® (ATP quantification) luminescent cell viability assay. Each sample was tested in 6 replicates and the experiment was repeated on 3 different days (one representative run shown). Error bars represent SE. Note the decrease in survival of 0% yCD in 3D culture at high doses of 5-FC
![Figure 2. Chemosensitivity in 2D (a) and 3D (b) culture. yCD and EV cells were mixed at various ratios respectively, 100%/0%, 80%/20%, 60%/40%, 40%/60%, 20%/80%, 0%/100%. Cells were treated with at increasing doses of 5-FC for 6 days, and viable cells detected using CellTiter-Glo® (ATP quantification) luminescent cell viability assay. Each sample was tested in 6 replicates and the experiment was repeated on 3 different days (one representative run shown). Error bars represent SE. Note the decrease in survival of 0% yCD in 3D culture at high doses of 5-FC](/cms/asset/c050f662-5c53-4ae5-ade4-ac4b629426b3/kcbt_a_1809912_f0002_b.gif)
Figure 3. Response of yCD/empty vector mixed tumors to 5-FC treatment. Tumors were raised from mixtures of yCD containing cells injected in six mice each bilaterally. After initial growth they were assigned to two groups by balancing tumor volume, and treated with diluent (saline) or 5-FC (500 mg/kg/day, IP) as represented by raw tumor volume (a) and relative tumor volume (b). Note initial regression in the 60% and 80% yCD mice, followed by expansion (20% yCD and 40% yCD tumors are presented in Supplemental ). Tumor volumes were compared to 100% yCD bearing cells after Day 35. *:p < .05, **:P < .001. Saline indicates the average of all controls. Error bars represent SE
![Figure 3. Response of yCD/empty vector mixed tumors to 5-FC treatment. Tumors were raised from mixtures of yCD containing cells injected in six mice each bilaterally. After initial growth they were assigned to two groups by balancing tumor volume, and treated with diluent (saline) or 5-FC (500 mg/kg/day, IP) as represented by raw tumor volume (a) and relative tumor volume (b). Note initial regression in the 60% and 80% yCD mice, followed by expansion (20% yCD and 40% yCD tumors are presented in Supplemental Figure 1). Tumor volumes were compared to 100% yCD bearing cells after Day 35. *:p < .05, **:P < .001. Saline indicates the average of all controls. Error bars represent SE](/cms/asset/a1e1a202-104f-4b7c-8513-1a64d6237b4c/kcbt_a_1809912_f0003_b.gif)
Table 2. Single-cell analysis of explanted tumors