Figures & data
Table 1. Association between selected markers in epithelial ovarian cancer
Table 2. The association of the expression of STAT1, PD-1, and PD-L1 with clinicopathological features of EOC patients
Figure 1. Immunohistochemical staining of STAT1, PD-1, and PD-L1 proteins and case rate of positive staining. (a) Expression of STAT1, PD-1, and PD-L1 proteins in normal ovarian tissues and epithelium-type ovarian tumors. An enlarged image was inserted in the up-right corner of the picture. A brown color in epithelial cells is considered positive staining. Representative images of STAT1, PD-1, and PD-L1 expression are shown. Original magnification × 100. Scale bar 200 µm. (b) The case rate of STAT1, P-D1, and PD-L1 positive and negative staining. The ratio of positive/negative was 2/38, 8/32, and 3/37 for STAT1, PD-1, and PD-L1, respectively, in control without tumor (40 cases); 0/36, 2/34, and 0/36 for STAT1, PD-1, and PD-L1, respectively, in the benign tumor (36 cases); 2/30, 3/29, and 0/32 for STAT1, PD-1, and PD-L1, respectively, in the borderline tumor (32 cases); 22/18, 19/21, and 21/19 for STAT1, PD-1, and PD-L1, respectively, in the malignant tumor (40 cases). For comparison between the two groups, the χ2 test was applied. Normal, normal ovarian tissue; Benign, benign tumor; Borderline, borderline tumor; Malignant, malignant tumor. *, P < .05; ***, P < .001
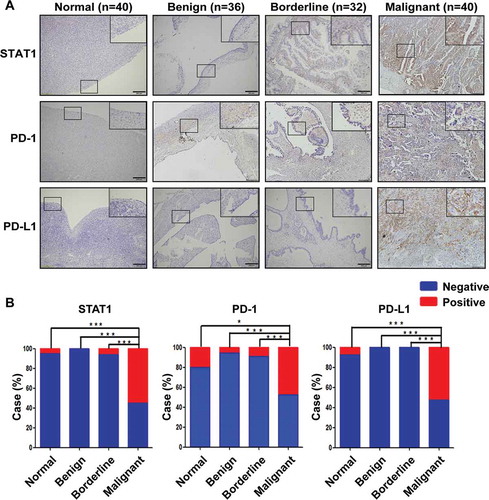
Figure 2. Expression of STAT1, PD-1, and PD-L1 in HOSEpiC and OVCAR-3 cells. (a) The expression of STAT1, PD-1, and PD-L1 mRNA was determined by quantitative RT-PCR. (b) The expression of STAT1, PD-1, and PD-L1 protein was determined by Western blot. (c) Densitometric analysis of the gels in (B). The number above the bar indicates a P-value
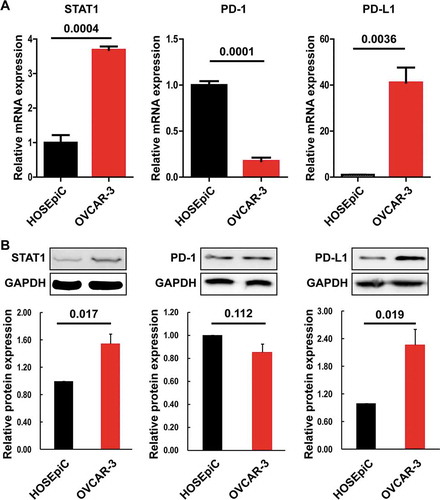
Figure 3. Expression of STAT1, PD-1, and PD-L1 in OVCAR-3 and OV3R-PTX cells. (a) The expression of STAT1, PD-1, and PD-L1 mRNA was determined by quantitative RT-PCR. (b) The expression of STAT1, PD-1, and PD-L1 protein was determined by Western blot. (c) Densitometric analysis of the gels in (B). The number above the bar indicates a P-value
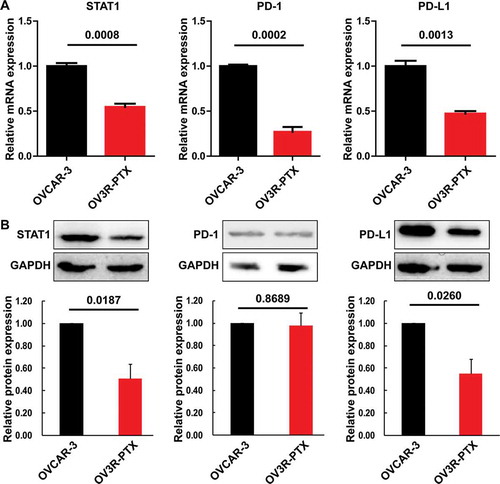
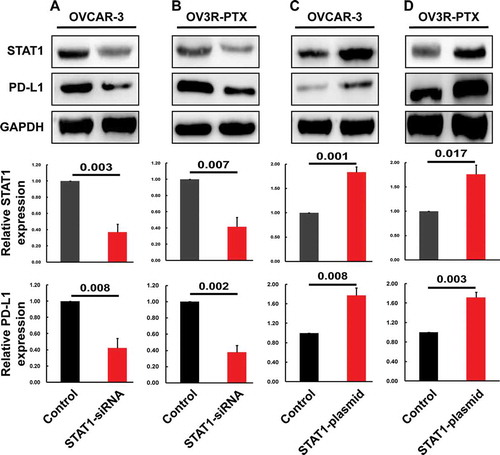
Figure 4. Expression of STAT1 and PD-L1 protein after transfection with STAT1-siRNA or STAT1 overexpressing plasmid in OVCAR-3 and OV3R-PTX cells. The expression of STAT1 and PD-L1 protein (top panel, Western blot image; middle and low panels, densitometric analysis of the gels) was decreased after STAT1-siRNA transfection in OVCAR-3 cells (a) and OV3R-PTX cells (b). The expression of STAT1 and PD-L1 protein (top panel, Western blot image; middle and low panels, densitometric analysis of the gels) was increased after STAT1 overexpressing plasmid transfection in OVCAR-3 cells (c) and OV3R-PTX cells (d). The number above the bar indicates a P-value