
Figures & data
Figure 1. SNVs potentially associated with recurrent HCC were identified using high-throughput whole-exome sequencing, PCR-MassArray, and Sanger DNA sequencing. (a) Frequency of gene mutations in the genome of a single HCC patient. Data from five exomic SNP profiles were combined. Nucleotide transversions in (b) primary HCC (n = 87) and (c) recurrent HCC (n = 34) tissue samples. (d) Illustration showing the presence of 70 verified SNVs in 69 genes and their chromosomal locations. (e) Mutant genes occurring with the highest frequency in primary HCC, recurrent HCC, and benign liver tumor tissues
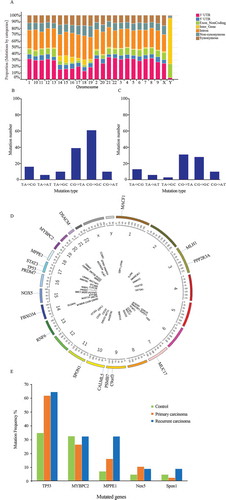
Table 1. Associations of mutation frequency with the risk of primary HCC or HCC recurrence
Table 2. Logistic regression analysis of the associations of gene mutations with the risk of primary HCC or HCC recurrence
Table 3. Associations between the MPPE1 mutation and the clinicopathological features of HCC disease and prognosis
Figure 2. Kaplan–Meier curves showing the association between tumor recurrence rate and the MPPE1 mutation. n = 121 HCC patients stratified by presence/absence of the MPPE1 mutation
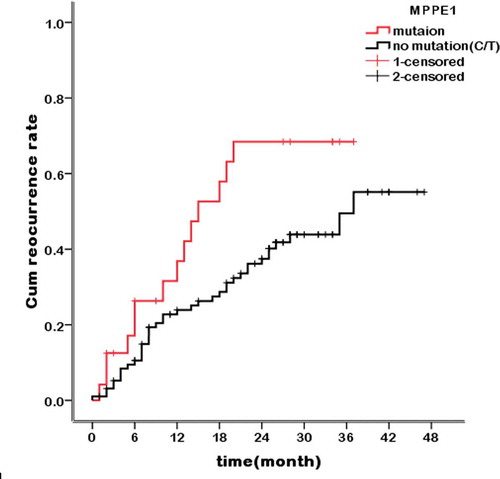
Figure 3. MPPE1 expression in HCC tumor samples and adjacent nontumor tissues based on data extracted from the GEO and TCGA (a) GSE22058, (b) GSE144520, (c) GSE63898, (d) TCGA_LIHC (**** P-value < 0.0001, *** P-value < 0.001, **P < .01)
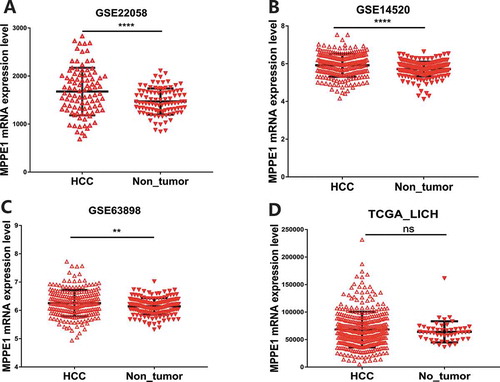
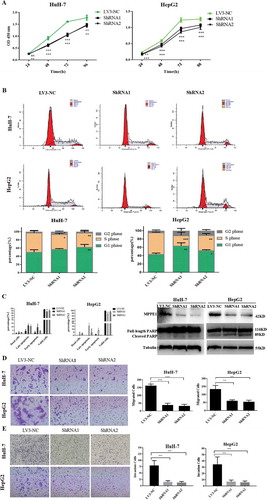
Figure 4. Functional analysis of MPPE1 knockdown in Huh-7 and HepG2 cells. (a) Knockdown of MPPE1 expression significantly inhibited cell growth in a CCK-8 assay (n = 5). (b) Knockdown of MPPE1 expression significantly increased the proportion of HuH-7 cells and HepG2 in the G0/G1 phase and significantly decreased the proportion of HuH-7 cells and HepG2 cells in the S phase. The DNA content of HCC cells was analyzed using PI staining and flow cytometry (n = 4). (c) Knockdown of MPPE1 expression significantly increased the percentage of apoptotic HCC cells, detected by flow cytometry, and increased the level of cleaved PARP, identified with Western blotting analysis. Tubulin was used as an internal control. (d) Knockdown of MPPE1 expression inhibited cell invasion in a Transwell assay. Invasive cells were counted under a microscope (200×) as the mean of ten randomly selected fields of view. (e) Knockdown of MPPE1 expression inhibited cell migration in a Transwell assay. Migrated cells were counted under a microscope (200×) as the mean of ten randomly selected fields of view. Error bars represent the SD of the mean value. Statistical analysis was performed by the two-tailed least-significant difference (LSD) t-test. *, P < .05, **P < .01, ***P < .001
Supplemental Material
Download MS Word (15.6 MB)Data availability
The datasets generated and analyzed during the present study are available from the corresponding author on reasonable request.