Figures & data
Table 2. Primer sequence of has_circ_0003204
Table 1. SiRNA sequence against has_circ_0003204
Figure 1. Overview of circRNA differential expression. (a) Hierarchical cluster analysis (heat map) for differentially expressed circRNAs between CC tissue and adjacent normal tissue. (b) Scatter plot demonstrating the variation of circRNAs expression in CC tissue (y-axis) versus control (x-axis). (c) GO enrichment of differentially expressed circRNAs d.KEGG pathway enrichment analysis of differentially expressed circRNAs
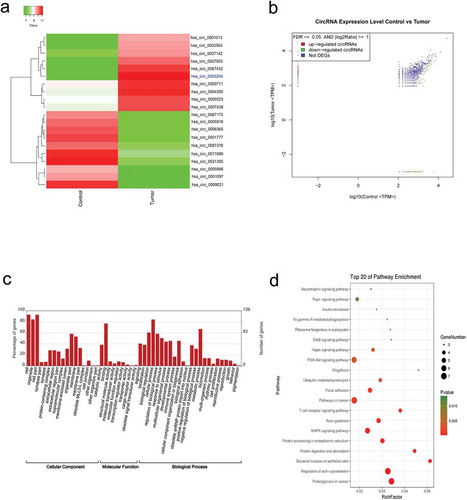
Figure 2. Upregulated hsa_circ_0003204 in cell lines. (a) Schematic diagram of hsa_circ_0003204 back-splice junctions and sequence of hsa_circ_0003204. (b) PCR result show Identification of back-splicing of hsa_circ_0003204. (c). Expression of hsa_circ_0003204 in CC cell lines
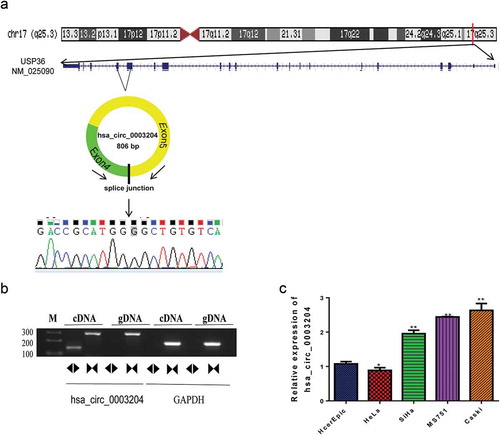
Figure 3. Silencing of hsa_circ_0003204 suppress cervical cancer cell proliferation, migration, invasion, and enhance apoptosis in vitro. (a) Validation of hsa_circ_0003204 in cell by qRT-PCR. (b) Silencing of hsa_circ_0003204 suppressed cell proliferation in both MS751 and Caski cells. (c) Silencing of hsa_circ_0003204 significantly prevent MS751 and Caski cells from entering into S phase. (d) Silencing of hsa_circ_0023404 significantly increased apoptosis of both MS751 and Caski. (e) Silencing of hsa_circ_0003204 significantly decreased migration of both MS751 and Caski. (f) Silencing of hsa_circ_0003204 significantly reduced invasion of both MS751 and Caski
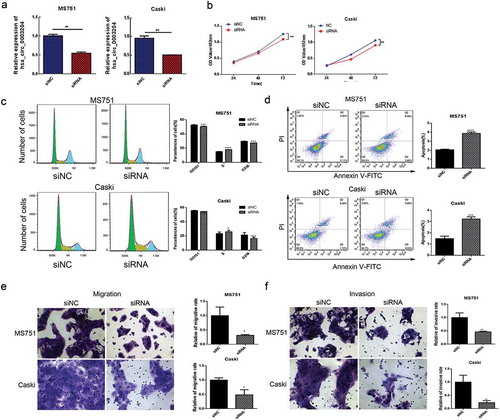
Figure 4. Overexpression of hsa_circ_0003204 promote CC cell proliferation, migration, invasion, and reduce apoptosis in vitro. (a) The expressions of hsa_circ_0003204 in SiHa and MS751 were significantly increased. (b) Overexpression of hsa_circ_0003204 promoted cell proliferation in both MS751 and SiHa cells. (c) Overexpression of hsa_circ_0003204 significantly increased S and G2/M phase of both MS751 and SiHa cells. (d) Overexpression of hsa_circ_0003204 significantly decreased apoptosis of both MS751 and SiHa cells. (e) Overexpression of hsa_circ_0003204 enhance migration of both MS751 and SiHa cells. (f) Overexpression of hsa_circ_0003204 enhance invasion of both MS751 and SiHa cells
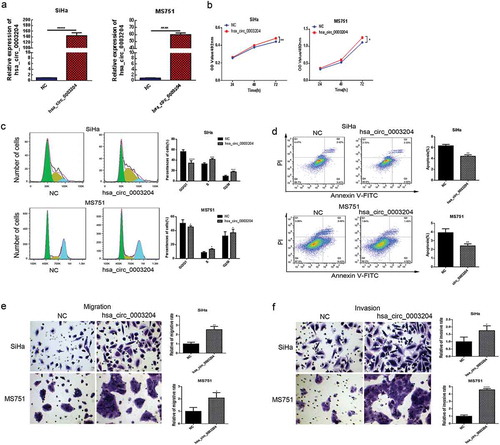
Figure 5. Construction of stable overexpression of hsa_circ_0003204 cell line and mRNA expression profile of hsa_circ_0003204 overpression cell. (a) Establishment of stable overexpression of hsa_circ_0003204 cell line with green fluorescent protein. (b) Validation of overexpression of hsa_circ_0003204 in cell by qRT-PCR. (c) Hierarchical cluster analysis (heat map) for differentially expressed mRNA between overexpression of hsa_circ_0003204 cell and negative control cell. (d) Volcano plot revealed the differentially expressed mRNA in overexpression of hsa_circ_0003204 cell compared to negative control cell
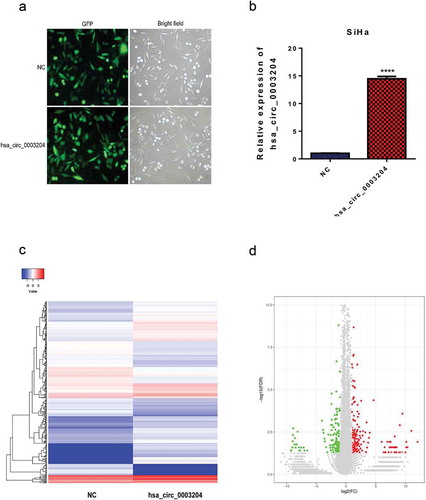
Figure 6. GO and KEGG analysis of differentially expressed mRNA function and pathways in hsa_circ_0003204 overpression cell. (a) GO enrichment of differentially expressed mRNA. (b) KEGG pathway enrichment analysis of differentially expressed mRNA. (c) Western blot analysis verified MAPK pathway regulated by hsa_circ_0003204
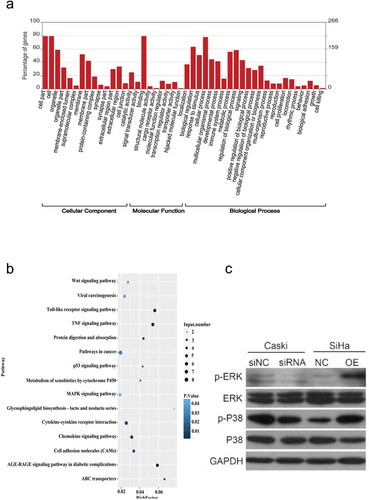
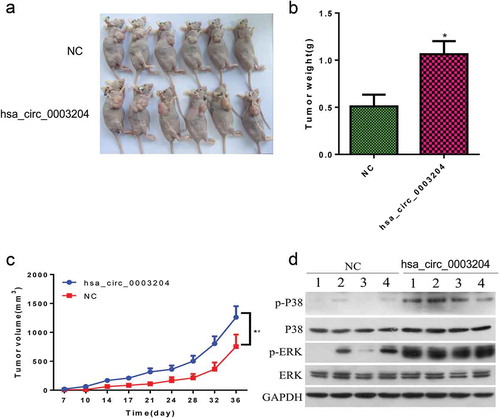
Figure 7. The effect of hsa_circ_0003204 on CC progression in vivo. (a) Subcutaneous xenografts excised from nude mice. (b) Bar graph shows tumor weight at the endpoint of the experiment. (c) The tumor growth curves. (e) Western blot analysis verified MAPK pathway regulated by hsa_circ_0003204. All data were expressed as mean ± standard deviation for three replicate determination. Student’s t-test was used for data analysis, p < .05 was considered statistically significant difference