Figures & data
Table 1. Cytarabine response pattern in first round of recruited patient samples
Figure 1. (a) Flow diagram showing AML patient recruitment, CANscriptTM prediction to cytarabine monotherapy and their clinical response. (b) Representative IHC images showing expression levels of: DNMT1, DNMT3A, DNMT3B, HDAC1, and HDAC6. The images were taken from sections of a tumor sample responder to cytarabine and a tumor sample nonresponder to cytarabine. The responder and nonresponders were determined from S-score, with S-Score > 19.1 being classified as responders and S-Score ≤ 19.1 being considered nonresponders. The IHC score (%) have been shown with each image. (c) IHC scores (%) are shown for the biomarkers DNMT1, DNMT3A, DNMT3B, HDAC1, and HDAC6, in two responder and four nonresponder samples. IHC scores were based on percentage of tumor cells expressing the marker
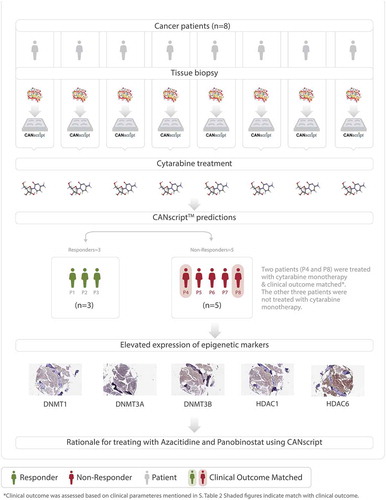
Figure 1. (Continued)
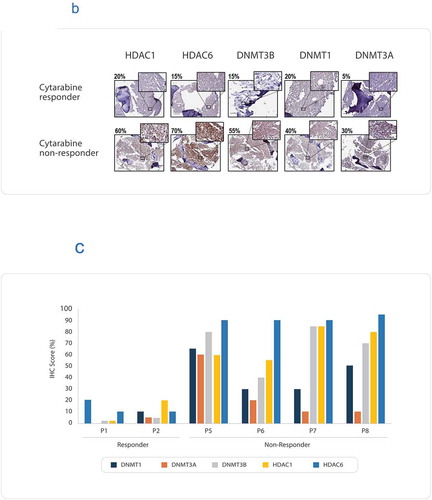
Table 2. Response pattern to the following drug arms (i) cytarabine, (ii) azacitidine, (iii) panobinostat, and (iv) combination of azacitidine and panobinostat in the second round of recruitment
Figure 2. (a) Flow diagram showing AML patient recruitment, CANscriptTM prediction to the indicated treatment arms and their clinical response. (b) Representative IHC images showing baseline expression levels of p-STAT3, in a azacitidine and panobinostat (Aza + Pano) responder and a Aza + Pano nonresponder. The responder and nonresponders were determined from S-score. (c) IHC scores (%) are shown for basal expression in two nonresponder and three responder samples. IHC scores were based on percentage of tumor cells expressing the marker
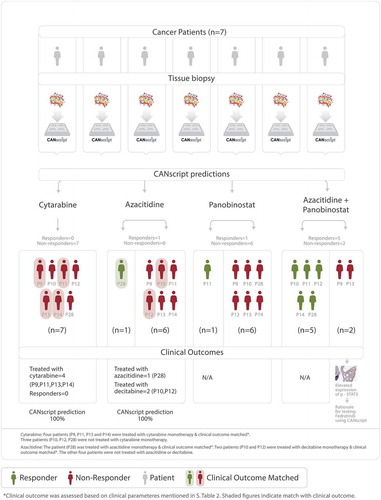
Figure 2. (Continued)
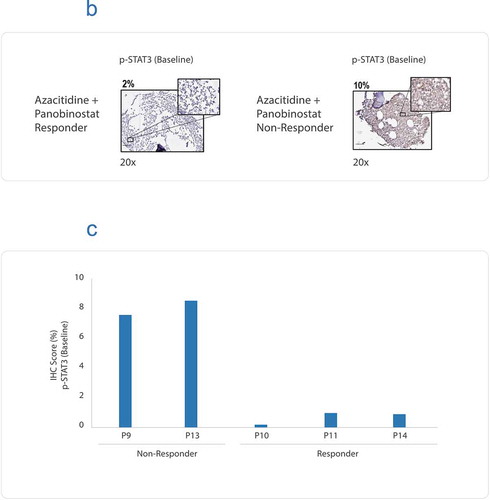
Table 3. The response pattern to the following drug arms (i) cytarabine, (ii) azacitidine, (iii) panobinostat, (iv) combination of azacitidine and panobinostat, and (v) Fedratinib in the final round of recruitment
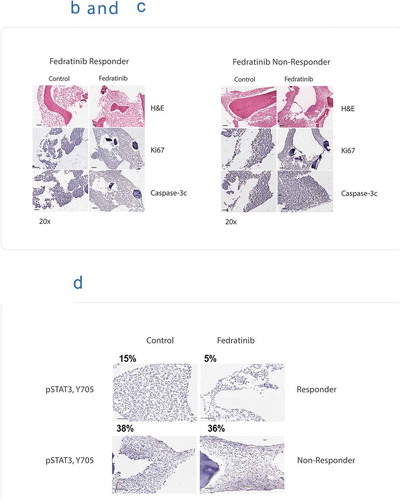
Figure 3. (a) Flow diagram showing AML patient recruitment, CANscriptTM prediction to the indicated treatment arms. (b) CANscriptTM identifies responders to fedratinib test arms of tumors refractory to all treatment arms of epigenetic modulators. Representative images taken from sections stained with H&E, Ki-67, and active Caspase-3. (c) CANscriptTM identifies nonresponders to fedratinib test arms of tumors refractory to all treatment arms of epigenetic modulators. Representative images taken from sections stained with H&E, Ki-67, and active Caspase-3. (d) Representative IHC images showing expression levels of p-STAT3 at basal and posttreatment with fedratinib, in a fedratinib responder and a nonresponder
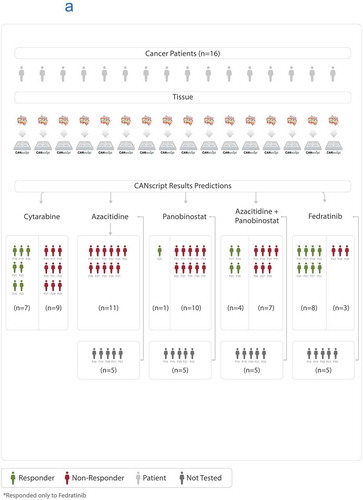
Figure 3. (Continued)