
Figures & data
Figure 1. 3D reconstruction from computed tomography scans showing massive liver and splenomegaly
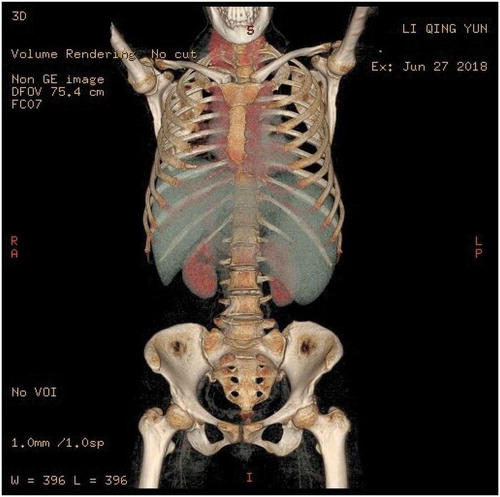
Figure 2. (Right cervical lymph node) biopsy: Lymph node structure destruction, follicular hyperplasia, sleeve atrophy or disappearance, cell morphology in follicles tend to be consistent, mainly center cells, central mother cells >15/HPF. IHC: CD20(+), BCL-2(+), BCL-6(+), CD10(+), MUM-1 partially (+), CD21 FDC (+), CD3(-), CD5(-), Ki-67 30%-40%
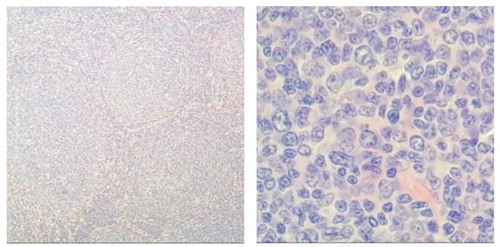
Figure 3. Bone marrow biopsy: HE and PAS staining showed more active bone marrow hyperplasia (70%), lymphocytosis (40–50%), focal and scattered distribution, infiltrating lesions were mostly located next to the trabecular, small cell bodies, irregular nuclei. The mature erythroid cells are scattered and the number of megakaryocytes is roughly normal. Reticulated fiber dyeing (MF-2 grade)
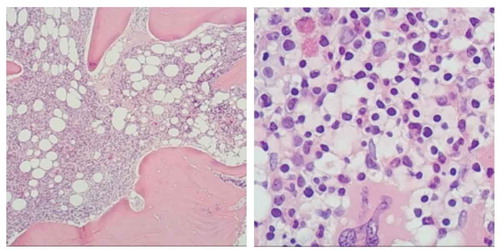
Figure 4. Platelet count during the rituximab contained chemotherapy period (Patient 1)
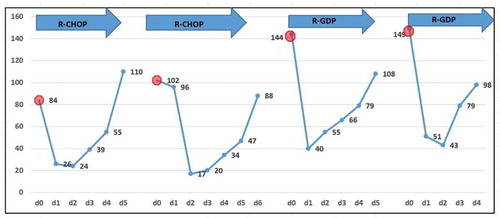
Figure 5. CA125, LDH, and β2-microglobulin during the chemotherapy period. After several cycles of chemotherapy including rituximab, the level of LDH and CA125 decreased to the normal level, indicating a rapid lysis of lymphoma cells occurred
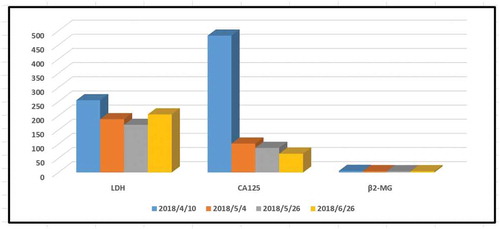
Figure 6. Bone marrow biopsy: HE and PAS staining showed that myeloid hyperplasia was normal (30–40%), small lymphocytes increased (40–50%), scattered and focal distribution, granulosa cells scattered in the mature stage, and the number of megakaryocytes was almost normal. Reticulated fiber staining (MF-2 grade, focal)
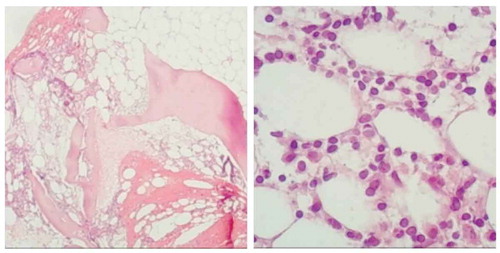
Figure 7. PET/CT showed an obvious splenomegaly was confirmed again and the SUV was about 2.3 with a Deauville Criteria 4 (the average SUV of the liver was 1.7)
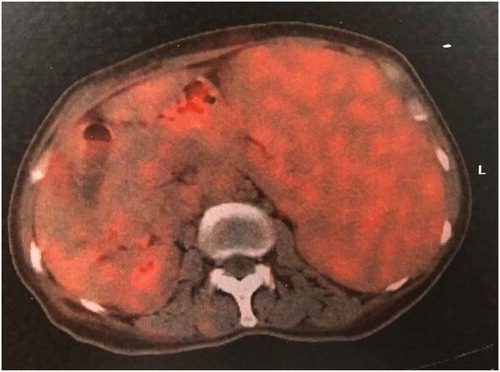
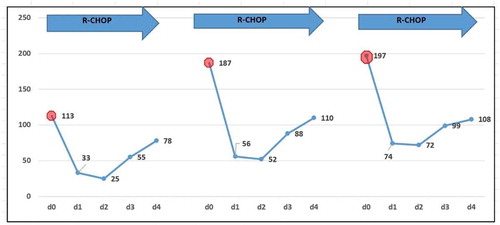
Figure 8. Platelet count during the rituximab contained chemotherapy period (Patient 2)
Data availability statement
The datasets used for analysis during the current study are available from the corresponding author on reasonable request.