
Figures & data
Figure 1. Increased expression of HMGA2 in TNBC cell lines and successful construction of shHMGA2 cell lines
(a): The expression level of HMGA2 protein in breast epithelial cells and six breast cancer cell lines was detected by Western blot. The expression level of HMGA2 protein was increased in TNBC cell lines, among which MDA-MB-231 was the highest. (c): HMGA2 expression levels in TNBC tumor tissue and non-TNBC tissue from the TCGA database. (d): HMGA2shRNA79 and HMGA2shRNA86 were, respectively, used to inhibit the expression of HMGA2 in MDA-MB-231, SUM149 cells, and Western blot was used to verify the inhibition efficiency of HMGA2. (b,e): The graphs panels were shown. (*P<.05, **P<.01, ***P<.001)
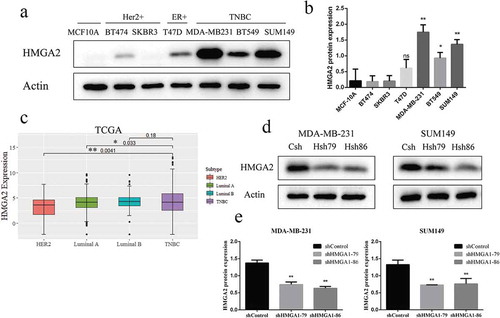
Figure 2. The effects of shHMGA2 on wound healing of TNBC cells
(a,c): wound healing test. The changes in scratch width were recorded with pictures at the corresponding time points; it showed that the cell healing of the TNBC cells slowed down after downregulation of HMGA2 protein. (b,d)): The graphs panels were shown. (*P<.05, **P<.01, ***P<.001)
Figure 3. The effects of shHMGA2 on migration and invasion abilities of TNBC cells
(a,b): Transwell assay. HMGA2 silencing inhibited the migration and invasion ability of MDA-MB-231, SUM149 cells (shHMGA2-79/86 group). (c,d): The graphs panels were shown. (*P<.05, **P<.01, ***P<.001)
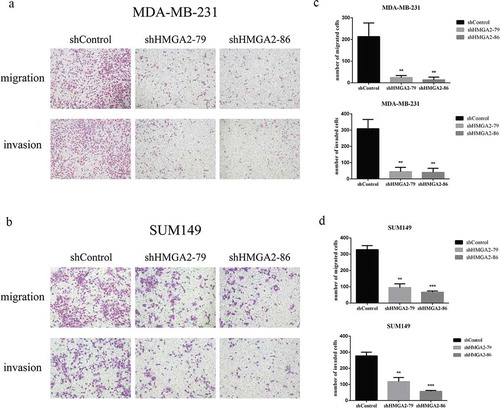
Figure 4. Effect of HMGA2 on the expression of EMT-related proteins
(a): Immunofluorescence staining of E-cadherin and vimentin in stable shHMGA2 cells or shControl cells. Green channel represents E-cadherin staining, the red channel represents vimentin staining, and the blue channel represents nuclear DNA staining by DAPI. (*P<.05) (b): Western blot test. Downregulate of HMGA2 can up-regulate epithelial markers (E-cadherin) and down-regulate interstitial markers (N-cadherin, Vimentin, Snail) of TNBC. (c): The graphs panels were shown. (*P<.05, **P<.01, ***P<.001)
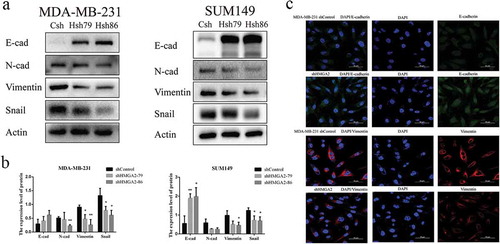
Figure 5. Interference with HMGA2 affects the expression of YAP protein
(a): The expression levels of YAP and p-YAP proteins were detected by Western Blot. The YAP protein level in the shHMGA2 (Hsh79/86) group decreased, while there was no significant change in ap-YAP protein. (b): The graphs panels were shown. (*P<.05, **P<.01, ***P<.001)
Figure 6. HMGA2 mediates the stability of YAP protein in TNBC
(a,c): MDA-MB-231 and SUM149 transfected cells were treated with CHX (20μM) for 0 h, 1 h, 2 h, 4 h, 6 h, 8 h.The knockdown of HMGA2 led to the increased turnover of YAP protein compared with the control cells, implying that HMGA2 regulates YAP stability. (b,d): The graphs panels were shown. (*P<.05, **P<.01, ***P<.001) E: Western blot was used to verify the inhibition efficiency of HMGA2.
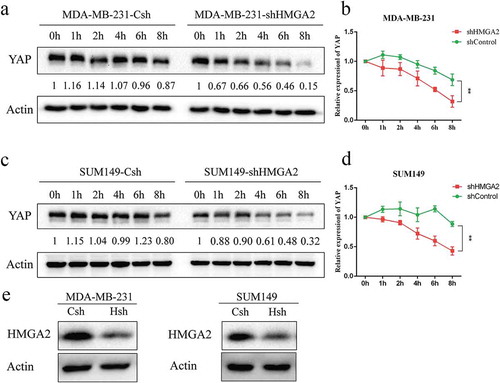
Figure 7. The decrease of the YAP protein level caused by proteasome activity
(a,b): MDA-MB-231 and SUM149 cells with (shHMGA2) or without (shControl) HMGA2 knockdown were treated with MG132 (20μM) or DMSO for 4 h.MG132 treatment prevented the decrease in the YAP protein level induced by HMGA2shRNA. (c,d): Cells were divided into the DMSO-treated group and MG132-treated group, and the YAP protein level in Hsh cells relative to that in Csh cells was calculated for each group. The graphs panels were shown. (*P<.05, **P<.01, ***P<.001)
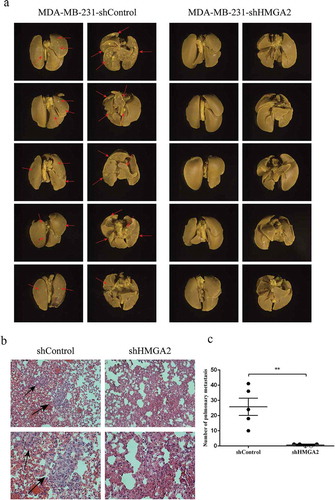
Figure 8. HMGA2 depletion suppresses metastasis in amouse xenograft model
(a): MDA-MB-231 shControl and shHMGA2 cell suspensions containing 2 × 10⁷ cells were injected into the caudal vein. Obvious metastasis was observed in the shControl group, represented by red arrows. (b): HE staining was performed and observed and photographed under the microscope of 200× and 400×, respectively. Obvious abnormal cells were observed in the shControl group, represented by black arrows. (c): the number of metastases in the shControl group was significantly higher than that in the shHMGA2 group. (*P<.05, **P<.01, ***P<.001)
Supplemental material