Figures & data
Figure 1. Comparison of bio-distribution of tail vein- and in situ-injected Cy5-ThioAp52 and Cy5-ThioControl probe in AsPC-1 xenograft mouse model. In vivo real-time imaging with tail vein-injected Cy5-ThioAp52 (a) or Cy5-ThioControl (b) at 0, 5, 60, 240, and 360 min post-injection, and with in situ-injected Cy5-ThioAp52 (c) or Cy5-ThioControl (d) (yellow circle at the right flank) at 0, 5 min, 4 h, 1, 2, 3, 4 and 5 d post-injection. Color scale applies to all figures. For each treatment group, results obtained with individual mice were consistent, and images from one mouse were shown
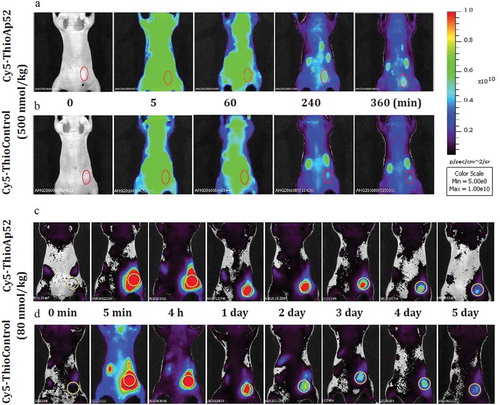
Figure 2. Binding assay of ThioAp52-Dox complex. Four pairs of cultured cancer cells (a, c, e, g) and corresponding noncancerous cells (b, d, f, h) were assayed with flow cytometry after 6 h treatment of ThioAp52-Dox (5.0 µM, green line), Dox (5.0 µM, red line), or control (culture medium only, black line). Cell lines: a) AsPC-1, b) hTERT-HPNE, c) Cal-27, d) OMF, e) MCF-7, f) MCF-10A, g) SK-MEL-28, h) Hs895.Sk
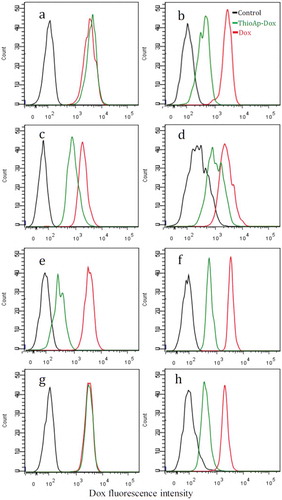
Figure 3. Uptake of FITC-ThioAp52-Dox by skin cells. Confocal laser scanning microscopy images of SK-MEL-28 (Rows I) and Hs895.Sk cells (Rows II) treated with 2.5 µM FITC-ThioAp52-Dox for 2 h (a) or 6 h (b). Columns 1) transmittance, 2) DAPI (blue), 3) FITC (for FITC-ThioAp52) (green), 4) Dox (red), and 5) superimposed image of 1) ~4). Yellow fluorescence in 5) indicates the localization of FITC-ThioAp52-Dox. Scale bar = 10 µm applies to all figures
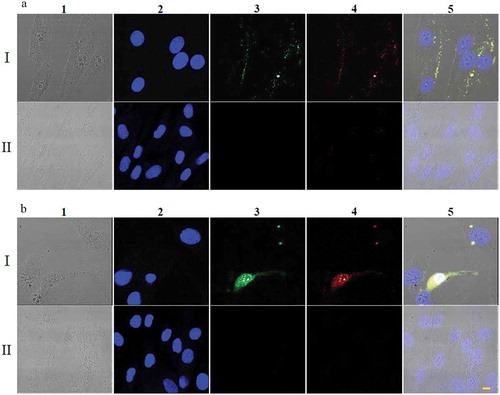
Figure 4. Targeting of FITC-ThioAp52-Dox to cancer cells. Confocal laser scanning microscopy images of three pairs of cultured cancer cells (Columns I) and corresponding normal/noncancerous cells (Columns II) after 2 h treatment of 2.5 µM FITC-ThioAp52-Dox or Dox. Cell lines: A. Pancreatic, I) AsPC-1, II) hTERT-HPNE; B. Oral, I) Cal-27, II) OMF; C. Breast, I) MCF-7, II) MCF-10A. All micrographs are merged images of transmittance, DAPI, FITC, and Dox (See Figure S3-S6 for images of individual channels). Yellow fluorescence in Columns I indicates the localization of FITC-ThioAp52-Dox complex. Scale bar = 10 µm applies to all figures
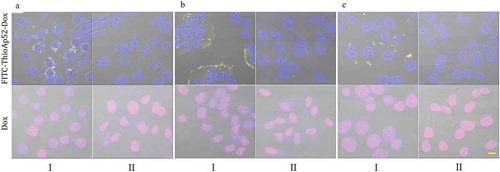
Table 1. Uptake analysis of FITC-ThioAp52-Doxa
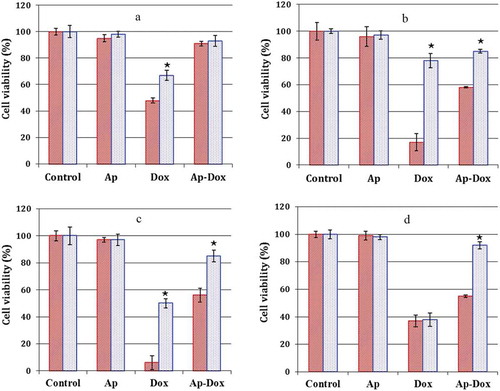
Figure 5. Cytotoxicity of ThioAp52-Dox. Cell viability assay in four pairs of cancer cells (![]()