Figures & data
Figure 1. PD-L1 expression profile of breast cancer on oncomine platform and of breast epithelial and cancer cell lines
Table 1. Clinical characteristics distribution in BMI groups
Table 2. Spearman correlation between clinical variables and PD-L1 expression in TNBC patients
Figure 2. IHC staining of PD-L1 in TNBC specimen, and the relationship of PD-L1 expression with macrophage-derived cytokine corresponding receptors and with obesity/MS promoting genes in TCGA breast dataset
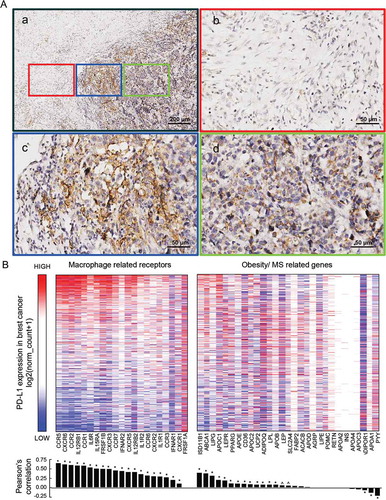
Figure 3. Effects of macrophages and telmisartan exert on PD-L1 expression in breast epithelial and cancer cell lines
Figure 4. JAK-STAT pathway is involved in MDA-MB-231 PD-L1 expression influenced by M1 and telmisartan
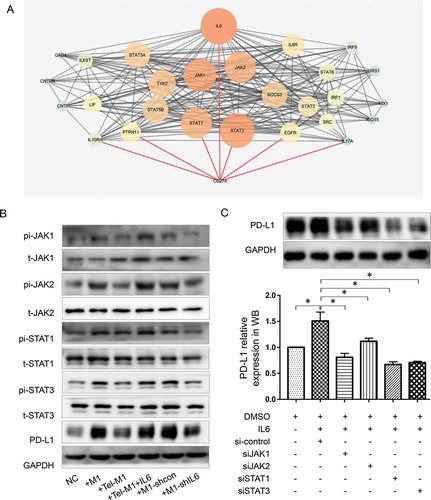
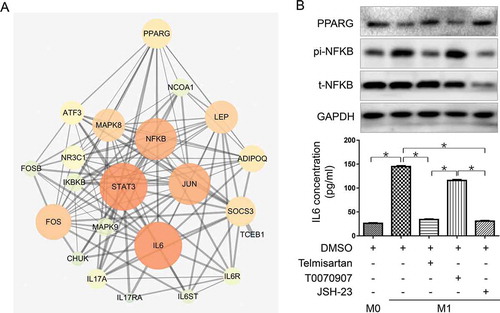
Figure 5. Telmisartan downregulates IL6 expression in M1 by activation of PPARG and inhibition of NFKB-p65