Figures & data
Figure 1. Treatment of lung cancer cells with DAC results in downregulation of Mcl-1 and upregulation of FBW7. (a) Human lung cancer H157, H460 and H1299 cells were treated with increasing concentrations of DAC for 24 h, followed by Western blot. (b) H1299 cells were treated with increasing concentrations of DAC for 10 days, followed by colony formation assay
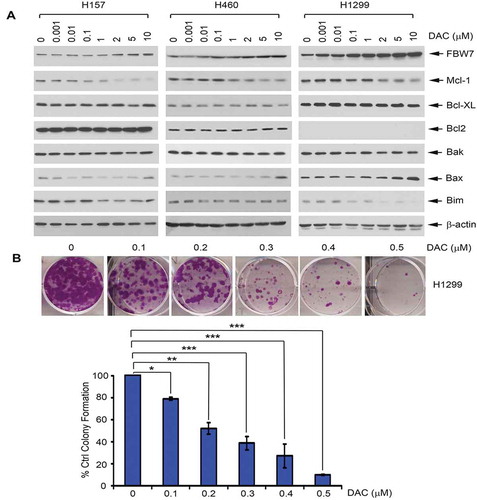
Figure 2. DAC reduces the half-life of Mcl-1 via increased ubiquitination in human lung cancer cells. (a) H1299 cells were treated with cycloheximide (100 μg/ml) in the absence or presence of decitabine (5uM) for various times. Levels of Mcl-1 were analyzed by Western blot. Mcl-1 protein was quantified by ImageJ software, followed by calculating the half-life of Mcl-1. (b) H1299 cells were transfected with HA-tagged ubiquitin constructs using NanoJuice transfection kit. After 24 h, cells were treated with MG132 for 2 h, then incubated with medium in the absence or presence of decitabine (5uM) for another 24 h, followed by anti-Mcl-1 IP. Mcl-1 ubiquitination was analyzed by Western blot using anti-HA antibody. 50 µg of total lysate was used as input control
Figure 3. DAC induces FBW7 demethylation and activation of FBW7 expression. (a) H1299 cells were treated with DAC (5 μM) for 72 h, followed by MSP for detection of methylated-FBW7 (m) and unmethylated FBW7 (u). (b) H1299 cells were treated with DAC (5 μM) for 72 h, followed by Western blot
Figure 4. DAC suppresses lung cancer growth in dose-dependent manner in vivo. (a) Nu/Nu nude mice carrying H460 xenografts were treated with increasing doses of DAC (2.5 ~ 10 mg/kg/d) i.p. for 8 days. Tumor volume was measured once every 2 days. After treatment, mice were sacrificed, and tumors were removed and analyzed. Data represent the mean ± SD, n = 6 per group. *P < .05, ***P < .001, by 2-tailed t test. (b) Methylated FBW7 and unmethylated FBW7 were measured by MSP in tumor tissues at the end of experiments. (c) Mcl-1 and Bcl-XL were analyzed by Western blot in tumor tissues at the end of experiments. (d) FBW7, Mcl-1, Ki67 and active caspase 3 were measured by IHC in tumor tissues at the end of experiments by IHC staining. Data represent the mean ± SD, n = 6 per group. *P < .05, **P < .01, ***P < .001, by 2-tailed t test
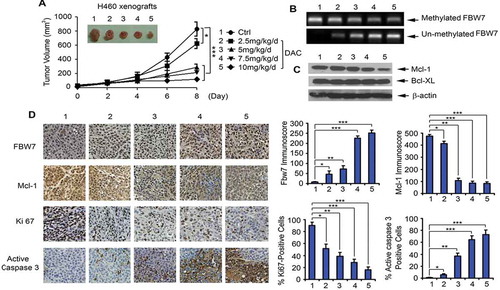
Figure 5. Toxicity of DAC in vivo. (a), (b) and (c) Body weight, blood analysis and H&E histology of various organs from Nu/Nu nude mice carrying H460 xenografts after treatment with increasing doses (0, 2.5, 5, 7.5, 10 mg/kg/d) of DAC for 8 days
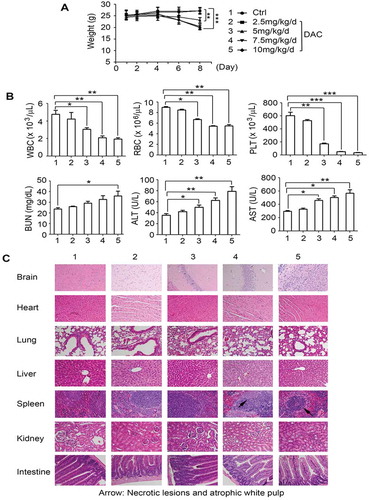
Figure 6. DAC synergizes with Bcl2 inhibitor ABT-199 (venetoclax) against lung cancer in vitro and in vivo. (a) and (b) Human lung cancer H460 and Calu-1 cells were treated with DAC (0.3 μM), ABT-199 (5 μM) or in combination, followed by colony formation assay. Data represent the mean ± SD, n = 3 per group. ***P < .001, by 2-tailed t test. (c) Nu/Nu nude mice carrying H460 xenografts were treated with DAC (3 mg/kg/d) i.p., ABT-199 (30 mg/kg/d) orally, or in combination for 14 days. Tumor volume was measured once every 2 days. After treatment, mice were sacrificed and tumors were removed and analyzed. Data represent the mean ± SD, n = 6 per group. *P < .05, by 2-tailed t test
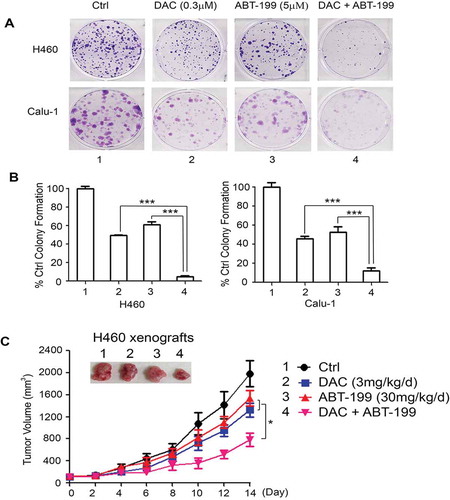
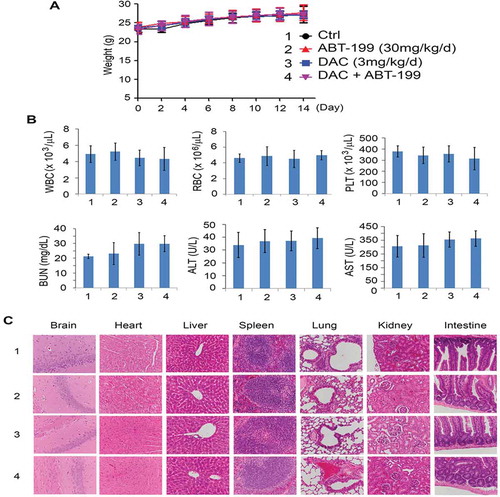
Figure 7. Toxicity of combined treatment with DAC and Bcl2 inhibitor in vivo. (a), (b) and (c), Body weight, blood analysis and H&E histology of various organs from Nu/Nu nude mice carrying H460 xenografts after treatment with DAC (3 mg/kg/d), ABT-199 (30 mg/kg/d), or in combination for 14 days