Figures & data
Figure 1. MTT assay of the cells infected with Adsur-DTA, Adsur-DTA176 or Adsur-DTA197. (a). A549, NCL-H292 or A427 cells were infected with Adsur-DTA, Adsur-DTA176, Adsur-DTA197, AdCMV-DTA197 or AdEmpty at 2, 10 or 50 MOI. (b). Western blot analysis of the DT-resistant 293 cells infected with Adsur-DTA or Adsur-DTA176, and of the 293 cells infected with Adsur-DTA197
Figure 2. Induction of tumor cell apoptosis by Adsur-DTA197. (a). A549 cells under the microscope that were either untreated (Con), infected with AdEmpty (EV), or infected with Adsur-DTA197 (Adsur-DTA197). Scale bar, 50 µm. (b). A549 cells with Hoechst staining. Scale bar, 25 µm. The cracked nuclei or condensed nuclei of the A549 cells appeared when they were infected with Adsur-DTA197. (c). Expression of the caspases was analyzed by western blotting analysis. The activated caspase-9, activated caspase-8, activated caspase-3 and cleaved PARP appeared in the Adsur-DTA197-infected cells
Figure 3. Flow cytometric analysis with PI staining. (a). Representative results of the flow cytometry with PI staining. (b). The sub-G1 proportion of the Adsur-DTA197-infected cells was much higher than that of the AdEmpty-infected cells (**p < .01). The cells treated with Adsur-DTA197 plus cisplatin showed more apoptotic cells than the cells treated with cisplatin alone (##p < .01)
Figure 4. Adsur-DTA197 showed how safe it is for normal cells in vivo. (a). Representative fields from the immunohistochemical staining by means of TUNEL staining of the muscle tissue of the mice treated with adenoviruses. (b). Adsur-DTA and Adsur-DTA176 were highly toxic to the muscle tissue. In comparison with AdCMV-DTA197, Adsur-DTA197 caused minimal toxicity in the muscle tissue of the mice (**p < .01)
Figure 5. Tumor volume (a) and survival time (b) of the mice treated with adenoviruses. The tumor volume of the Adsur-DTA197-treated group was clearly inhibited in comparison with that of the AdEmpty-treated group (*p < .01); and in both the A549 tumor-bearing mice and the NCL-H292 tumor-bearing mice, survival time was prolonged in the Adsur-DTA197-treated mice in comparison with the AdEmpty-treated mice (*p < .05). In comparison with the cisplatin treatment, the cisplatin combined with Adsur-DTA197 treatment showed a significantly enhanced antitumor effect both in tumor volume (##p < .01) and in survival time (#p < .05)
Figure 6. TUNEL staining of the xenografted tumor. (a). Representative fields of the TUNEL staining. (b). The Adsur-DTA197-treated mice showed more apoptotic cells in comparison with the mice treated with empty viruses (**p < .01). In comparison with the cisplatin treatment, the cisplatin combined with Adsur-DTA197 treatment caused more apoptotic cells (##p < .01). Scale bar, 50 µm
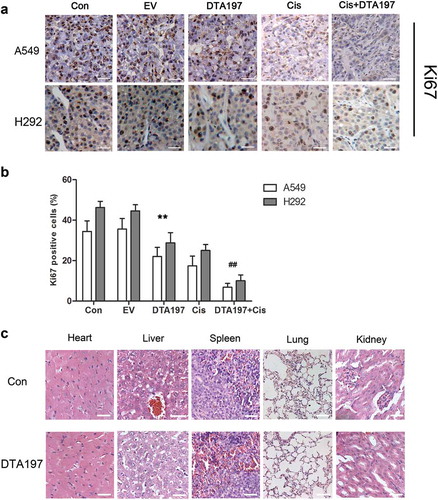
Figure 7. Histopathological analysis of the mice. (a). Representative fields of the immunohistochemical staining of the Ki67 from the A549- or NCL-H292-xenografted tumors. (b). Statistical data of the Ki67-positive cells. The Adsur-DTA197 treatment resulted in a decreased percentage of Ki67-positive cells in comparison with the two control groups (**p < .01). The cisplatin plus Adsur-DTA197 group showed fewer Ki67-positive cells in comparison with the cisplatin group (##p < .01). (c). Representative fields of the sections of the vital organs of the mice. No obvious changes in the sections were found under microscopic examination. Scale bar, 50 µm