
Figures & data
Figure 1. Detection of HPV-DNA in the peripheral blood of patients with non-small cell lung cancer. (a)HPV universal primer amplification electrophoresis map; (b)HPV16-specific primer amplification electropherogram; (c)HPV18-specific primer amplification electropherogram. Note: M: marker; PC: positive control
Table 1. Comparison of clinical-pathological parameters betweenHPV16-DNA-positive and HPV16-DNA-negative non-small cell lung cancer patients
Table 2. Differentially expressed miRNAs in lung adenocarcinoma
Table 3. Differentially expressed miRNAs in lung squamous cell carcinoma
Figure 2. Heat map clustering of differentially expressed miRNA microarray data. (a) Heat map of differentially expressed miRNAs in lung adenocarcinoma; (b) heat map of differentially expressed miRNAs in lung squamous cell carcinoma. Red represents upregulated miRNAs; the darker the color, the more pronounced the upregulation. Green represents downregulated miRNAs; the darker the color, the more pronounced the downregulation
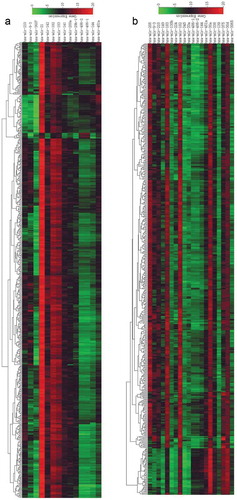
Figure 3. The expression levels of eight miRNAs in the plasma of normal human subjects, HPV16-DNA (-) NSCLC patients, and HPV16-DNA (+) NSCLC patients were measured. RT-qPCR was used to analyze the plasma levels of miR-182 (a), miR-183 (b), miR-9-3 (c), miR-210 (d), miR-144 (e), miR-451-a (f), miR-486-1 (g), and miR-486-2 (h) in 52 healthy subjects, 84 HPV16-DNA (-) NSCLC patients, and 16 HPV16-DNA (+) NSCLC patients. Note: *: P< .05, **: P < .01, ns: P > .05; the smaller the ΔCt value, the higher the expression
Table 4. The efficacy of plasma miR-182, miR-183, miR-210 and miR-144 to distinguish HPV16-DNA-positive NSCLC cases from healthy controls
Figure 4. Analysis of the value of four miRNAs for the diagnosis of HPV16-DNA-positive NSCLC and healthy individuals. (a-d) The ROC curve was used to assess the value of miR-182, miR-183, miR-210 and miR-144 in the diagnosis of HPV16-DNA-positive NSCLC. (miR-182, 0.858, P < .0001; miR-183, 0.843, P < .0001; miR-210, 0.950, P < .0001; and miR-144, 0.881, P < .0001.)
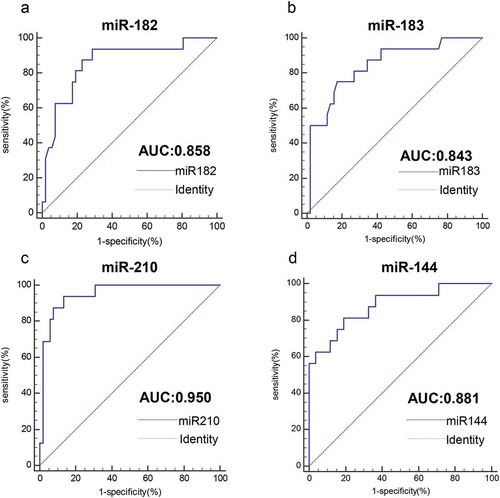
Figure 5. Analysis of the value of combined miRNAs for the diagnosis of HPV16-DNA-positive NSCLC and healthy individuals. (a-f) The ROC curve shows that for the distinction between HPV16-DNA-positive NSCLC and healthy individuals, the combined detection of the two miRNAs is more accurate than the single miRNA
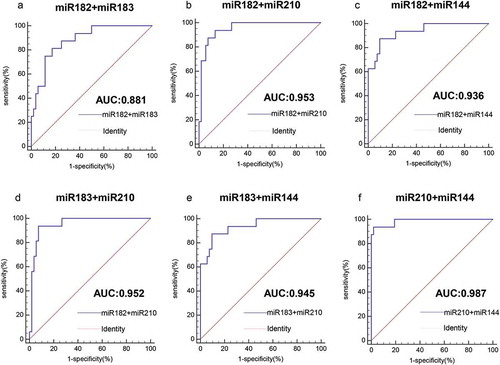
Table 5. Efficacy of plasma miR-182, miR-183, miR-210 and miR-144 to distinguish HPV16-DNA-positive NSCLC patients from HPV16-DNA-negative NSCLC patients
Figure 6. Value analysis of four miRNAs for the diagnosis of HPV16-DNA-positive NSCLC patients and HPV16-DNA-negative NSCLC patients. (a-d) The ROC curve was used to assess the value of miR-182, miR-183, miR-210 and miR-144 in the diagnosis of HPV16-DNA-positive NSCLC. (miR-182, 0.746, P< .0001; miR-183, 0.753, P < .0001; miR-210, 0.865, P < .0001; miR-144, 0.729, P < .0001.)
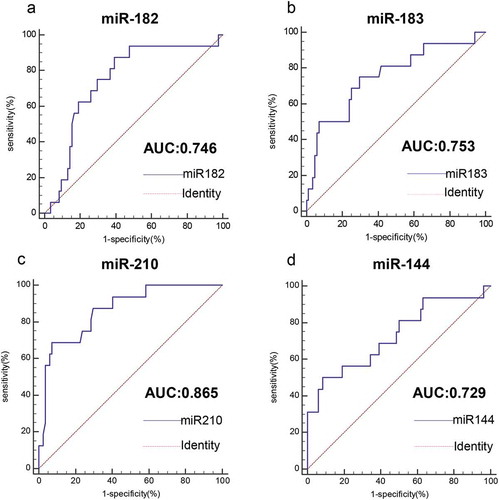
Figure 7. Analysis of the value of combined miRNAs for the diagnosis of HPV16-DNA-positive NSCLC patients and HPV16-DNA-negative NSCLC patients. (a-f) The ROC curve shows that for the distinction between HPV16-DNA-positive NSCLC and HPV16-DNA-negative NSCLC patients, the combined detection of the two miRNAs is more accurate than the single miRNA
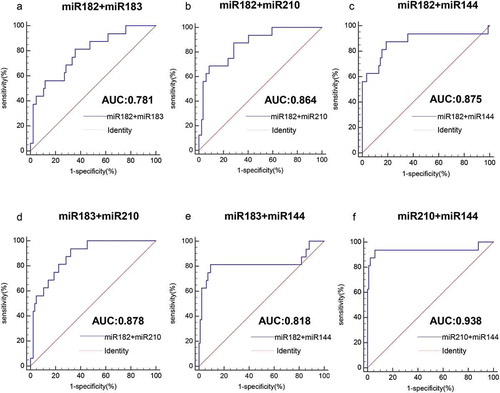
Table 6. HPV universal primers, HPV16 and HPV18 nested-PCR primers
Table 7. The sequence of miRNA-specific forward primer