
Figures & data
Figure 1. Effects of Sonoporation: At lower power the sonoporation can cause ruptures in cell membranes, increasing the permeability of individual cells. As power increases sonoporation can cause gaps between and through cells causing pooling of blood and an increased permeabilization of a regional area to drug, this is the modality of interest. As power continues to increase sonoporation can cause the rupture of the ultrasound contrast agents which can completely disrupt blood supply in a specific region
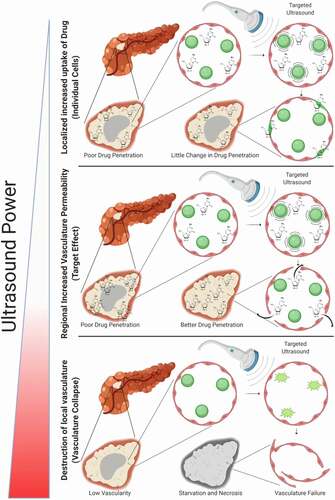
Table 1. Comparison of ultrasound contrast agents
Figure 2. Tumor growth for IV treated mice: A,B) Comparison of all treatment arms across low and high ultrasound power respectively C-F) Comparison of total tumor volume for ultrasound alone vs individual ultrasound contrast agents (SonoVue + drug + US, Sonazoid+ drug + US, Optison+ drug + US and Definity+ drug + US, respectively) against chemotherapy split by high and low ultrasound power settings
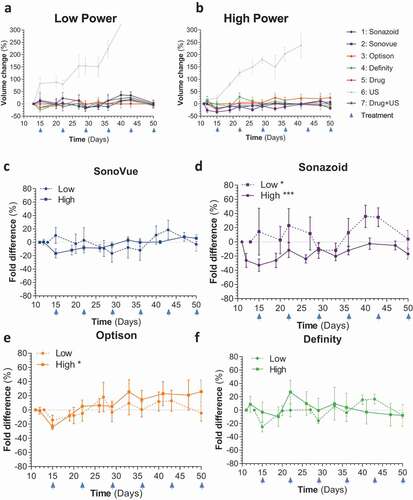
Figure 3. Tumor vascularity for IV treated mice: A-B) Comparison of all treatment groups as broken down by low and high ultrasound power by tumor vasculature % fold change
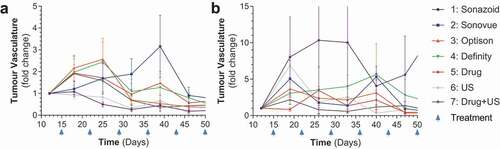
Figure 4. Tumor volumes of IP treated mice: A) Tumor volumes of all mice normalized as percentage difference in fold change to the chemotherapy treated control B)Comparison of high vs low ultrasound power differences against chemotherapy C-F) Comparison of individual ultrasound contrast agents (SonoVue+ drug + US, Sonazoid+ drug + US, Optison+ drug + US and Definity+ drug + US, respectively) against chemotherapy split by high and low ultrasound power settings
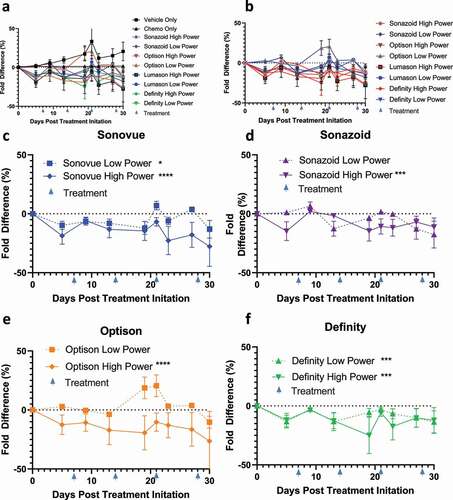
Figure 5. Measures of tumor vascularity: A-E) Comparison of vehicle and individual ultrasound contrast agents against chemotherapy % total O2 in tumors split by high power settings F) Comparison of tumor oxygenation at baseline prior to sonoporation with Sonazoid in the high acoustic power cohort and after sonoporation treatment has been completed (4 weeks later just prior to sacking). This image depicts an overall increase in oxygenation from 49% to 53% within the imaging plane (and from 41% to 54% within the entire tumor volume of this animal). G) Tumors were stained with CD31 (red) staining epithelial cells, and counterstained with tomato lectin (green indicating endothelial cells) and DAPI staining (blue demonstrating cellularity)
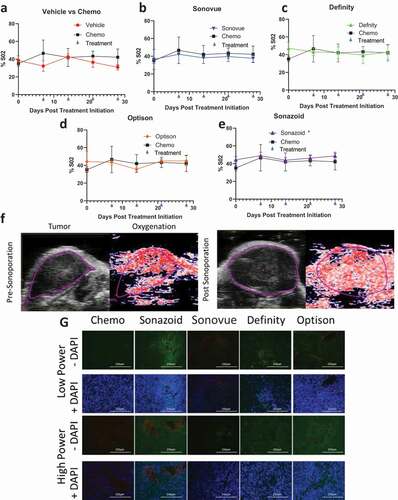
Table 2. Overall comparisons