Figures & data
Table 1. Sample information
Table 2. Primers for real-time quantitative PCR analysis
Figure 1. Effects of trametinib on cell viability and activation of cell signaling in dog bladder cancer (BC) organoids. Experimental schema of analysis of BC organoids (a). After BC organoids were generated from urine samples of BC diseased dogs, they were used for the following experiments. Protein expression and activated level of EGF-related signals in BC organoids (b). Expression level of phosphorylation of EGFR, total EGFR, phosphorylation of ERK, and total ERK was compared between normal bladder epithelial cells (NB) and several strains of BC organoids (Or1-5) as determined by Western blotting (n = 3). Equal loading amounts of protein was confirmed by total VCP antibody. Histological analysis of BC organoids (c). Representative images of hematoxylin and eosin (H&E) staining of each BC organoid were shown. Scale bar: 100 μm. Representative phase-contrast images (scale bar: 500 μm) of the sensitivity of BC organoids to different concentrations of trametinib for 72 h using Prestoblue cell viability assay (d, n = 3–6) and its quantification (e). 100% represents cell viability of each control. Results were expressed as mean ± SEM. Effects of trametinib on activation of EGFR and ERK in BC organoids. After BC organoids were seeded into Matrigel, they were treated with trametinib for 3, 6, 12 and 24 hours. Expression level of phosphorylation of EGFR and ERK was determined by Western blotting (f, g, n = 4–5). Equal protein loading was confirmed using total actin antibody. Results were expressed as mean ± S.E.M. ﹡P < .05 vs. control. Effects of trametinib on expression of downstream signal of ERK in BC organoids. Expression of c-Myc, ETS transcription factor, ETS Like-1 protein (ELK1), Salt-Inducible Kinase 1 (SIK1), and phospholipase A2 group 4A(PLA2G4A) mRNA was determined by quantitative real-time PCR (h). Expression level of each gene was quantified based on the ration of expression level to GAPDH and shown as fold increase relative to control (n = 4). Results were expressed as mean ± S.E.M. ﹡P < .05 vs. control
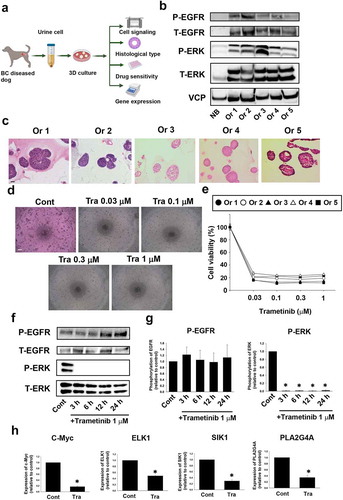
Figure 2. Effects of trametinib on cell cycle arrest and apoptosis in BC organoids. After BC cells were treated with trametinib (1 μM for 24 h), they were stained with propidium iodide (PI). Distribution of cell cycle phases (G0/G1, S, and G2/M) of BC organoid cells was analyzed by flow cytometry (a). The population of G0/G1, S and G2/M phases in BC organoids was expressed as mean ± S.E.M (n = 4). ﹡P < .05 vs. control. Effects of trametinib on expression of cell cycle-related genes in BC organoids (b). Expression of cyclin D1, cyclin A2, cyclin E1, CDK4, CDK6, p21, and p16 mRNA was determined by quantitative real-time PCR. Expression level of each gene was quantified based on the ration of expression level to GAPDH and shown as fold increase relative to control (n = 4). Results were expressed as mean ± S.E.M. ﹡P < .05 vs. control. Expression of cyclin D1 in trametinib-treated BC organoids. Representative photomicrographs were shown (n = 3). Scale bar: 50 μm (c). Expression level was quantified by counting the cyclin D1-positive cells (d, n = 3). Results were expressed as mean ± S.E.M. ﹡P < .05 vs. control. Effects of trametinib on apoptosis in BC organoids (e). After BC cells were treated with trametinib (1 μM for 72 h), they were stained with terminal deoxynucleotidyl transferase dUTP nick end labeling (TUNEL). DNase-treated organoid cells were used as the positive control (n = 3). The green fluorescence area indicates apoptotic-positive organoids cells and the blue DAPI staining shows intact DNA. The white arrows indicate apoptotic-positive cells. Scale bar: 50 μm. Quantification of apoptosis in trametinib-treated and non-treated cells was analyzed by ImageJ software (F, n = 3). Results were expressed as mean ± S.E.M. ﹡P < .05 vs. control
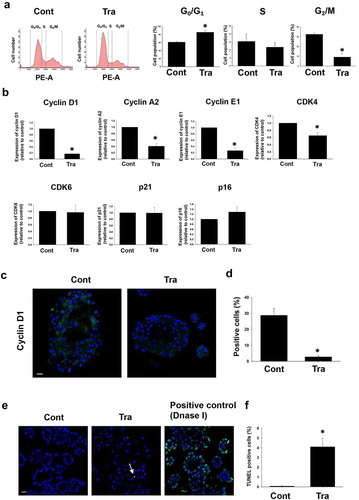
Figure 3. Effects of trametinib on stemness of BC organoids. Expression levels of CD44 and YAP1 mRNA in trametinib-treated (1 μM, 24 h) BC organoids were determined by quantitative real-time PCR (a). Expression level of each gene was quantified based on the ration of expression level to GAPDH and shown as fold increase relative to control (n = 4). Results were expressed as mean ± S.E.M. ﹡P < .05 vs. control. Expression of CD44 and YAP1 protein in trametinib-treated (1 μM, 24 h) BC organoids. Representative photomicrographs were shown (b, n = 3). Scale bar: 50 μm. Combinational effects of YAP inhibitor and trametinib on cell viability of BC organoids (c). Representative phase-contrast images of the trametinib (1 μM) alone, in combination with YAP1 inhibitor, verteporfin (VP) (0.3 μM), or VP (0.3 μM) alone for 72 h on BC organoids. Scale bar: 500 μm. The enlarged images were shown below for each image. Cell viability was assessed using Prestoblue kit and 100% represents the cell viability of each control (d, n = 6). Results were expressed as mean ± S.E.M. ﹡P < .05 vs. control, #P < .05 vs. trametinib. Apoptosis level was assessed by TUNEL staining in each BC organoid (e). Scale bar: 50 μm. Quantification of apoptosis in each BC organoid was analyzed by ImageJ software (f, n = 4). Results were expressed as mean ± S.E.M. ﹡P < .05 vs. control, #P < .05 vs. trametinib
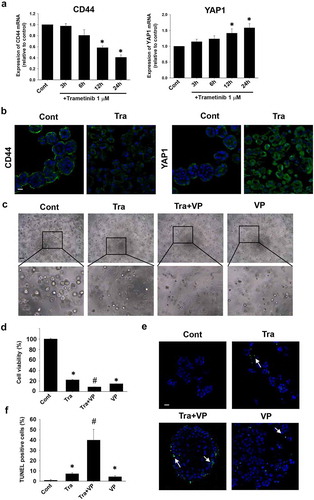
Figure 4. Effects of trametinib on morphologic/phenotypic plasticity of BC organoids. Representative bright-field images (a) and H&E staining (b) of the differentiated BC organoids compared with control ones after trametinib (1 μM) treatment for 72 h. Scale bar: 500 μm. The enlarged images were shown below for each image. The ratio of basal-like and luminal-like organoids was quantified by using ImageJ software (c, n = 4). Effects of trametinib on expression of basal and luminal marker genes in BC organoids (d). mRNA expression of basal cell markers, CK5 and DSG3 and luminal cell ones, ERBB2 and GATA3 was determined by quantitative real-time PCR. Expression level of each gene was quantified based on the ration of expression level to GAPDH (n = 4). Results were expressed as mean ± S.E.M.﹡P < .05 vs. control. Expression of CK5 in trametinib-treated BC organoids. Representative photomicrographs were shown (e). The white arrows indicate apoptotic-positive cells. Scale bar: 50 μm. Expression level was quantified by counting the CK5-positive cells (F, n = 3). Results were expressed as mean ± S.E.M. ﹡P < .05 vs. control
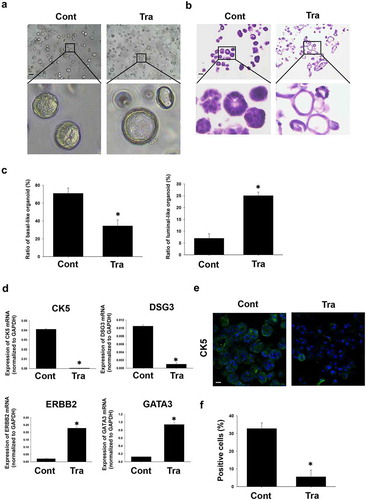
Figure 5. Effects of trametinib on tumor growth against xenografted BC organoids in immunodeficient mice. Experimental schema of in vivo experiment (a). After BC organoid cells were subcutaneously injected into the back of SCID mice and tumors formed, trametinib and the vehicle was administered to the mice at the concentration of 1 mg kg−1 for 4 weeks. Thereafter, the tumor volume was measured by clipper every week for 6 weeks (B, n = 6). Tumor tissues of each group was isolated and used for analysis. Comparison of tumor growth curve (b), size (c), and weight (d) between trametinib- or vehicle- administered mice. Results were expressed as mean ± S.E.M. ﹡P < .05 vs. vehicle. Representative H&E staining images of the tumor tissue sections from trametinib- or vehicle- administered mice (e). Scale bar: 200 μm. Confocal microscopy fluorescence images of apoptosis as determined by TUNEL staining of frozen sections of tumor tissues from trametinib-treated or vehicle- administered mice (f, n = 3). Sections treated with DNase I were used as a positive control. Scale bar: 50 μm. Expression level of CK5 in sections from dissected tumors of trametinib- or vehicle-administered mice as determined by confocal microscopy (g, scale bar: 50 μm). Expression level was quantified by counting the CK5-positive cells (h, n = 3). Results were expressed as mean ± S.E.M. ﹡P < .05 vs. vehicle
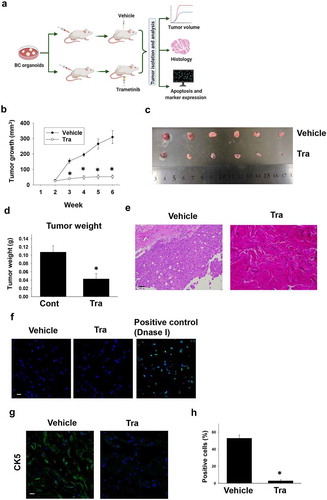
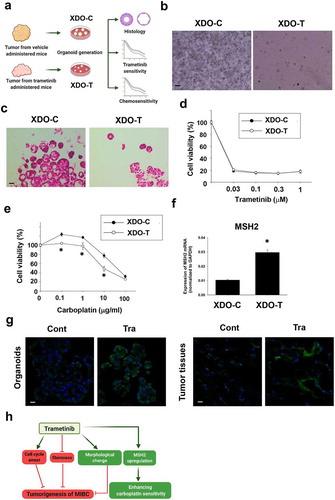
Figure 6. Effects of long-term trametinib administration to mice on drug sensitivity of xenograft-derived organoids. Experimental schema of generation of xenograft-derived organoids from trametinib administered and vehicle-administered mice and the analysis (a). Bright field (b) and H&E staining (c) images of the vehicle (XDO-C) and trametinib (XDO-T) administered mice-derived tumor organoids. Scale bar: 500 μm. Sensitivity to trametinib (d, n = 3–6) and carboplatin (e, n = 3–6) was analyzed by Prestoblue kit. Results were expressed as mean ± S.E.M. 100% represents the cell viability of each control. Expression of a carboplatin sensitivity-related gene, MSH2 mRNA in each organoid was determined by quantitative real-time PCR. Expression level of gene was quantified based on the ration of expression level to GAPDH (f, n = 4). Results were expressed as mean ± S.E.M. ﹡P < .05 vs. vehicle. Expression level of MSH2 in xenografted tumor-derived organoids and original tissues (g, n = 3) from trametinib- or vehicle-administered mice. Scale bar: 50 μm. Schematic summary of the present study (h). Trametinib promoted cell cycle arrest, inhibited stemness, changed the phenotype of BC organoids, which may lead to the inhibitory effects of tumorigenesis in vivo. Besides, long-term trametinib administration enhanced the sensitivity to carboplatin through upregulation of MSH2 gene in the tumor tissues