
Figures & data
Table 1. Cell lines and culture medium used in this study
Table 2. qRT-PCR primer sequences
Figure 1. MiR-133b is lowly expressed in LUAD
A: Volcano plot of differential miRNAs in TCGA-LUAD dataset; B: Overall survival analysis of LUAD patients (n = 470) with different miR-133b expressions; C: The expression of miR-133b in TCGA, with green boxplot representing the normal samples (n = 46) and red boxplot representing the tumor samples (n = 521); D: The expression of miR-133b in normal cell line BEAS-2B and LUAD cell lines A549, PC9, H1299 and H1975; * represents p < .05.
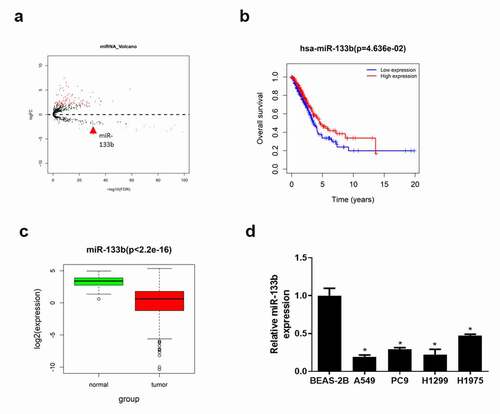
Figure 2. Overexpressing miR-133b suppresses the proliferation, migration and invasion of LUAD cells
A549 and H1299 cells with stable miR-133b overexpression were formed. A: qRT-PCR testified miR-133b expression in A549 and H1299 cells; B: The proliferative ability of cells evaluated by CCK-8; C: Transwell invasion assay detected invasive ability of LUAD cells A549 and H1299 in each group (100×); D-E: Wound healing assay (40×) and Transwell migration assay (100×) detected migratory ability of LUAD cells A549 and H1299 in each group; * represents p < .05.
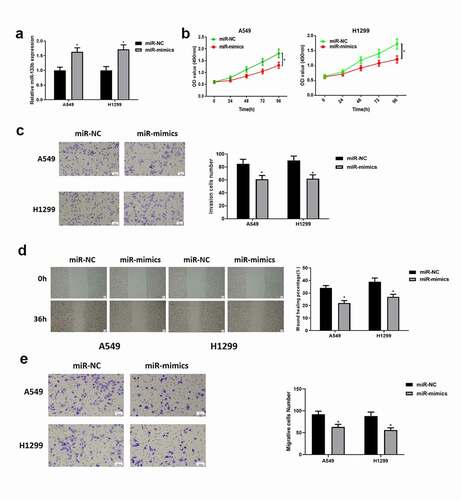
Figure 3. SKA3 is upregulated and correlated with poor prognosis in LUAD
A: Volcano plot of differential mRNAs in TCGA-LUAD; B: Venn diagram of the differentially upregulated mRNAs in TCGA-LUAD and the predicted target genes; C: Pearson correlation analysis for miR-133b and 9 candidate predicted target genes; D: Overall survival analysis of LUAD patients (n = 504) with different expressions of SKA3; E: The expression of SKA3 in TCGA with green boxplot representing normal samples (n = 59) and red boxplot representing tumor samples (n = 535); F-G: Relative mRNA and protein expressions of SKA3 in the normal cell line BEAS-2B and LUAD cell lines A549, PC9, H1299 and H1975; * represents p < .05.
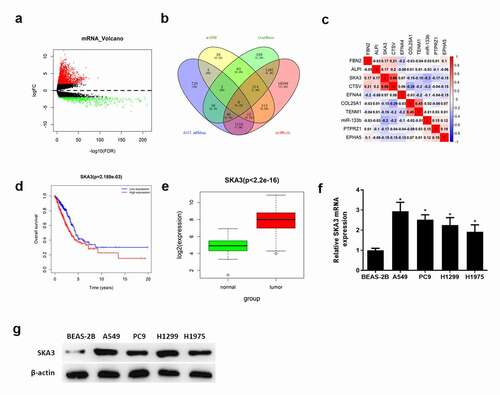
Figure 4. MiR-133b downregulates the expression of SKA3
A: Putative binding sites of miR-133b on SKA3 3ʹUTR; B: Luciferase reporter gene analysis of LUAD cell lines A549 and H1299 in different treatment groups; C-D: qRT-PCR and western blot were performed to detect the expression of SKA3 mRNA and protein in LUAD cell lines A549 and H1299 in different treatment groups; * represents p < .05.
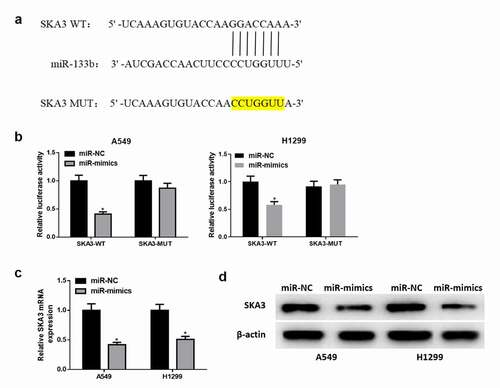
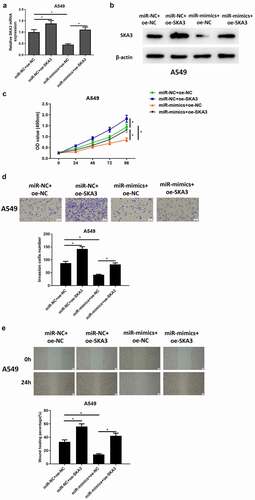
Figure 5. MiR-133b suppresses the proliferation, migration and invasion of LUAD cells through targeting SKA3
A-B: A549 cells with stably overexpressed SKA3, overexpressed miR-133b or simultaneously overexpressed SKA3 and miR-133b were generated and SKA3 mRNA and protein expression were testified by qRT-PCR and western blot; C: Cell proliferation detected by CCK-8; D-E: Cell invasion and migration detected by Transwell assay (D) (100×) and wound healing assay (E) (40×); * represents p < .05.
Supplemental material