Figures & data
Table 1. Primer sequence
Figure 1. Identification of CAFs and EVs. The CAFs and NFs were successfully isolated from COAD tissues and adjacent normal tissues of patients undergoing colon cancer surgery. (a) Immunofluorescence was used to observe the morphology of CAFs and the expressions of surface markers vimentin, α-SMA, and FAP; (b) The purity of NFs and CAFs was detected using flow cytometry. The EVs were extracted. (c) The morphology of EVs was observed by TEM; (d) The size distribution of EVs was analyzed using NTA; (e) The expressions of CD9, CD63, and Calnexin were analyzed using WB.
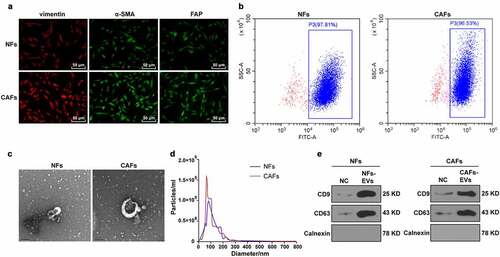
Figure 2. EVs promoted the proliferation, migration, and angiogenesis of HUVECs induced by colon cancer cells. COAD cell lines SW480 and HCT116 were cultured and co-incubated with CAFs-EVs or NFs-EVs for 24 h. (a) The uptake of EVs was observed using immunofluorescence. Then, SW480 and HCT116 cells in different EVs treatment groups were co-cultured with HUVECs. (b) The proliferation of HUVECs was measured using CCK-8; (c) The migration was detected using Transwell assay; (d) The number of connections was measured to quantify the tube formation of HUVECs; (e) The VEGF content in HUVECs supernatant was detected using ELISA. Three cell tests were performed and the data were expressed as mean ± standard deviation. Independent t test was used for comparison among multiple groups. *P < .05, **P < .01.
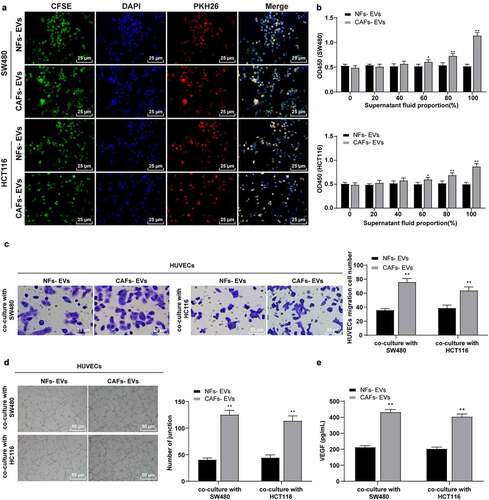
Figure 3. CAFs-EVs carried miR-135b-5p into COAD cells. (a) The miR-135b-5p expression pattern in COAD was analyzed using the ECORI Pan-Cer database. The CAFs and EVs were treated differently, and (b–d) The expression pattern of miR-135b-5p was detected by RT-qPCR. SW480 and HCT116 cells were treated with EVs of different treatment groups. (e) miR-135b-5p expression pattern in COAD cells was detected by RT-qPCR. Three cell tests were performed and the data were expressed as mean ± standard deviation. One-way ANOVA was used for comparison among groups. Tukey’s multiple comparisons test was used for the post hoc test. **P < .01.
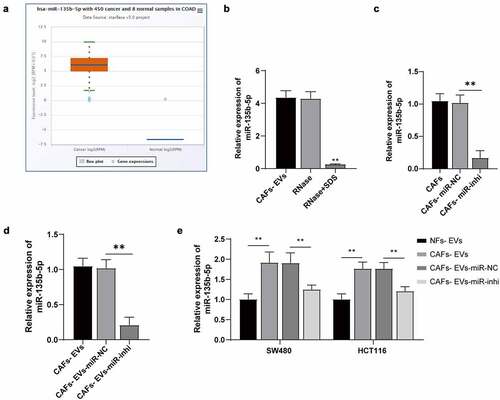
Figure 4. The inhibition of miR-135b-5p in EVs partially reversed the effect of EVs on promoting angiogenesis induced by COAD cells. SW480/HCT116 cells treated with EVs of different treatment groups were co-cultured with HUVECs. (a) The proliferation of HUVECs was detected using CCK-8; (b) The migration was detected using Transwell; (c) The number of connections was measured to quantify the tube formation of HUVECs on the substrate; (d) The VEGF content in HUVECs supernatant was detected using ELISA. Three cell tests were performed and the data were expressed as mean ± standard deviation. One-way ANOVA was used for comparison among multiple groups. Tukey’s multiple comparisons test was used for the post hoc test. *P < .05, **P < .01.
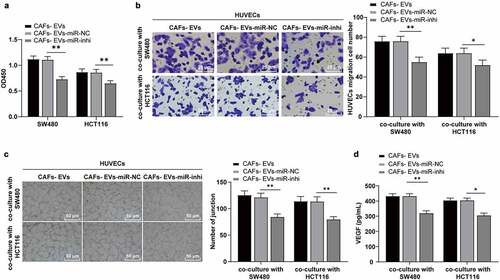
Figure 5. miR-135b-5p targeted FOXO1. (a) Venn map of StarBase, RNAInter, Targetscan, and miRDB database were used to predict the connections of miR-135b-5p downstream target genes; (b) Co-expression network of candidate genes; (c–d) ECORI Pan-Cer database was used to analyze the expression pattern of FOXO1 in COAD and its correlation with miR-135b-5p; (e) StarBase was used to predict and analyze the targeted binding relationship between miR-135b-5p and FOXO1; (f) The targeted binding was verified by dual-luciferase reporter assay; (g) The expression of FOXO1 mRNA in SW480/HCT116 co-cultured with HUVECs was detected by RT-qPCR. Three cell tests were performed and the data were expressed as mean ± standard deviation. Independent t test was used for comparison of the data in F and one-way ANOVA was used for comparison of the data in G. Tukey’s multiple comparisons test was used for the post hoc test. **P < .01.
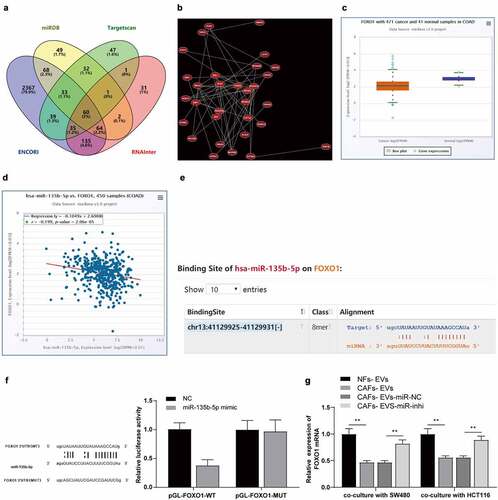
Figure 6. Overexpression of FOXO1 reversed the effect of EVs on promoting angiogenesis. The FOXO1 was overexpressed in CAFs-EV-treated SW480/HCT116 cells. (a) The expression pattern of FOXO1 was detected using WB; (b) The proliferation of HUVECs was detected using CCK-8; (c) The migration was detected using Transwell; (d) The number of connections was measured to quantify the tube formation of HUVECs; (e) The VEGF content in HUVECs supernatant was detected using ELISA. Three cell tests were performed and the data were expressed as mean ± standard deviation. One-way ANOVA was used for comparison among groups. Tukey’s multiple comparisons test was used for the post hoc test. **P < .01.
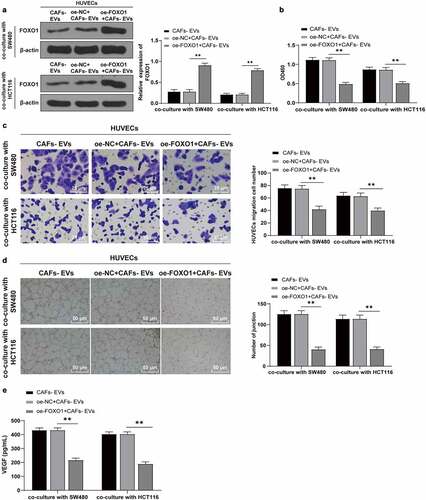
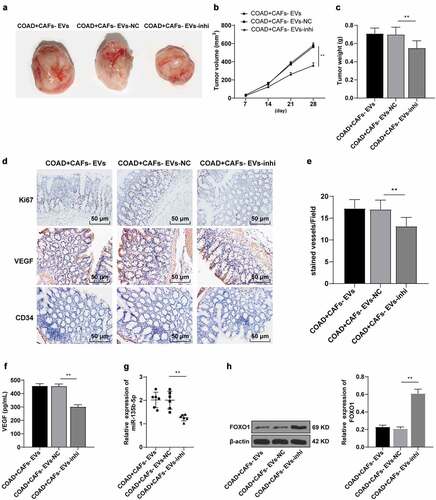
Figure 7. CAFs-EVs promoted angiogenesis of xenograft tumors in vivo. The nude mouse model of COAD was established by transplanting SW480 cells into the skin of nude mice. The mice were injected with CAFs-EVs of different treatment groups through the tail vein. (a–c) The growth rate, volume, and weight of the tumor were observed and measured. The tumor tissues were collected. (d) The expression patterns of Ki67, VEGF, and CD34 were detected using immunohistochemistry; (e) Microvessel density (MVD) was reflected by the number of CD34 microvessels; (f) The VEGF content in HUVECs supernatant was detected using ELISA; (g) The expression of miR-135b-5p was detected by RT-qPCR; (h) The expression pattern of FOXO1 was detected by WB. N = 6; the data were expressed as mean ± standard deviation. One-way ANOVA was used for comparison among multiple groups. Tukey’s multiple comparisons test was used for the post hoc test. **P < .01.