Figures & data
Table 1. Demographic and clinical characteristics of HCC patients with APF
Figure 1. Treatment response in DEB-TACE group and cTACE group. A: Comparison of total treatment response between DEB-TACE group and cTACE group; B: Comparison of ORR and DCR between DEB-TACE group and cTACE group. DEB-TACE: drug-eluting beads transarterial chemoembolization; cTACE: conventional transarterial chemoembolization; CR: complete response; PR: partial response; SD: stable disease; PD: progressive disease; ORR: objective response rate; DCR: disease control rate.
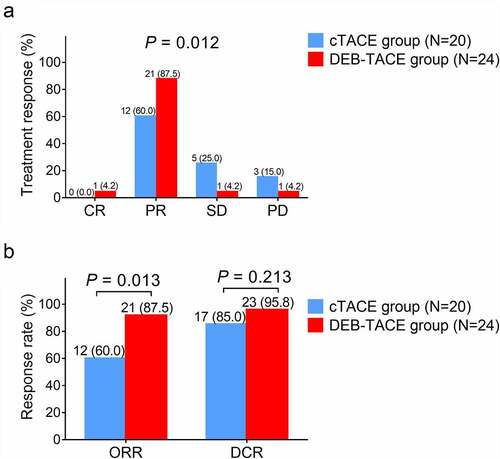
Figure 2. PFS and OS in DEB-TACE group and cTACE group. A: Comparison of PFS between DEB-TACE group and cTACE group; B: Comparison of OS between DEB-TACE group and cTACE group. DEB-TACE: drug-eluting beads transarterial chemoembolization; cTACE: conventional transarterial chemoembolization; PFS: progression-free survival; OS: overall survival.
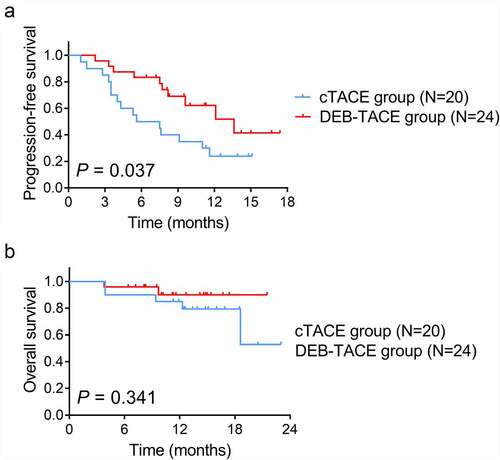
Table 2. Analysis of hepatic function after treatment
Table 3. Adverse events
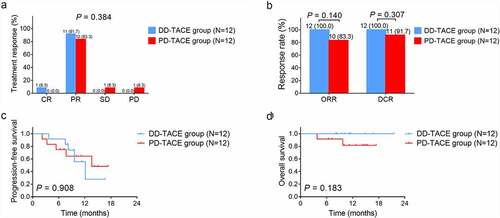
Figure 3. Treatment response and survival in the DD-TACE group and PD-TACE group. A: Comparison of total treatment response between DD-TACE group and PD-TACE group; B: Comparison of ORR and DCR between DD-TACE group and PD-TACE group; C: Comparison of PFS between DD-TACE group and PD-TACE group; D: Comparison of OS between DD-TACE group and PD-TACE group. CR: complete response; PR: partial response; SD: stable disease; PD: progressive disease; ORR: objective response rate; DCR: disease control rate; PFS: progression-free survival; OS: overall survival.