Figures & data
Figure 1. High expression of lncRNA PVT1 in glioma tissues and cells related to poor prognosis. (a), LncRNA PVT1 expression determined by RT-qPCR in clinical samples of patients with glioma (N = 75) and normal samples (N = 10). (b), LncRNA PVT1 expression determined by RT-qPCR in HEB cell line and glioma cell lines. (c), Correlation of lncRNA PVT1 expression with patients’ survival analyzed by the Kaplan-Meier method (N = 75). * p < .05. The experiment was repeated 3 times independently.
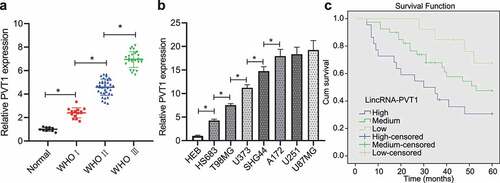
Figure 2. P53 targets lncRNA PVT1. (a), p53 expression determined by RT-qPCR in clinical samples of glioma patients (N = 75) and normal samples (N = 10). (b), p53 expression determined by RT-qPCR in glioma cell lines. (c), Correlation of p53 expression with patients’ survival analyzed by the Kaplan-Meier method (N = 75). (d), Pearson correlation of p53 expression with lncRNA PVT1 expression in clinical samples of patients with glioma (N = 75). (e), Transfection efficiency of oe-p53 and siRNA-p53 determined by RT-qPCR in glioma cells. (f), LncRNA PVT1 expression determined by RT-qPCR in glioma U373 cells following p53 overexpression. (g), LncRNA PVT1 expression determined by RT-qPCR in glioma U373 cells following p53 knockdown. (h), Interaction between lncRNA PVT1 and p53 confirmed by RIP assay in glioma cells. (i), Binding sites between lncRNA PVT1 promoter and p53 predicted on lncATLAS website. (j), Binding of p53 to lncRNA PVT1 promoter confirmed by dual-luciferase reporter gene assay in 293 T cells. * p < .05. The experiment was repeated 3 times independently.
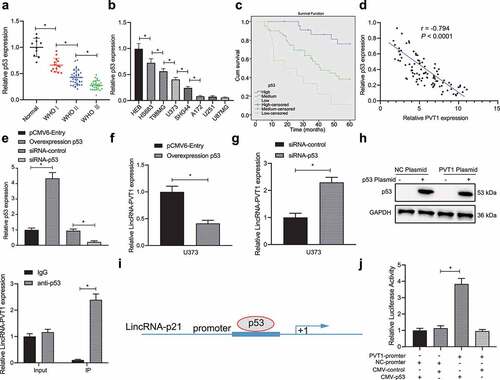
Figure 3. P53 targeting lncRNA PVT1 restrains glioma cell proliferation, migration, and invasion, whereas inducing apoptosis in vitro. (a), Transfection efficiency of siRNA-PVT1 and siRNA-p53 determined by RT-qPCR in U373 cells. (b), U373 cell viability measured by CCK-8 assay. (c), U373 cell proliferation measured by EdU assay. (d), U373 cell cycle distribution detected by flow cytometry. (e), U373 cell migration and invasion measured by Transwell assay. (f), Expression of N-cadherin, MMP3, E-cadherin, and MMP9 proteins in U373 cells determined by Western blot analysis. (g), U373 cell apoptosis measured by flow cytometry. * p < .05. The experiment was repeated 3 times independently.
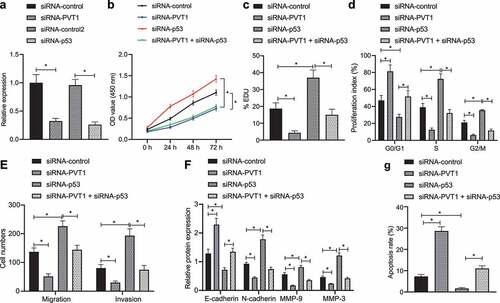
Figure 4. P53 mediates the TGF-β/Smad pathway by targeting lncRNA PVT1. (a), Expression of the TGF-β/Smad pathway-related proteins in clinical samples of patients with glioma (N = 75) and normal samples (N = 10) determined by Western blot analysis. (b), Binding between TGF-β and lncRNA PVT1 analyzed by dual-luciferase reporter gene assay. (c), Expression of the TGF-β/Smad signaling pathway-related proteins in U373 cells determined by Western blot analysis. * p < .05. The experiment was repeated 3 times independently.
Figure 5. P53 targeting lncRNA PVT1 prevents tumor growth and curbs apoptosis in vivo through the TGF-β/Smad pathway. (a), Representative images showing xenografts in nude mice injected with U373 cells transfected with sh-PVT1, sh-p53 or both. (b), Growth of human glioma xenogratf tumor measured every 8 days in nude mice injected with U373 cells transfected with sh-PVT1, sh-p53 or both. (c), Expression of p53 and lncRNA PVT1 in tumor tissues determined by Western blot analysis. (d), Expression of TGF-β and Smad2/3 and the extent of Smad2/3 phosphorylation in tumor tissues determined by Western blot analysis. (e), Expression of Caspase-3, Bax, Bcl-xL, and Bcl-2 proteins determined by Western blot analysis. N = 6 for mice upon each treatment. * p < .05. The experiment was repeated 3 times independently.
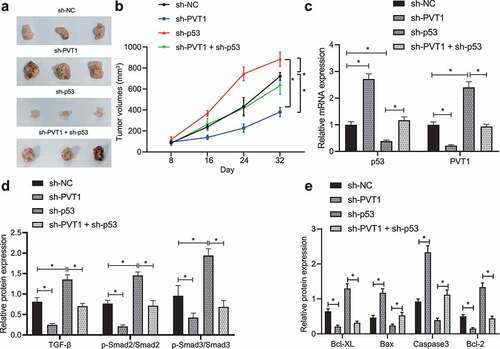
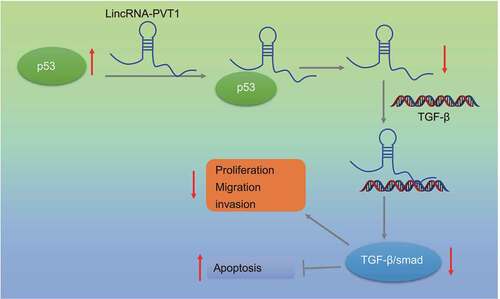
Figure 6. Mechanism diagram displaying the effect of the p53-mediated lncRNA PVT1/TGF-β/Smad axis on the proliferation, migration, invasion, and apoptosis of glioma cells.