
Figures & data
Figure 1. Preliminary screening of valuable genes. (a) Cluster dendrogram of EC samples in MERAV. (b) Left: Analysis of the scale-free fit index for various soft-thresholding powers (β). Right: Analysis of the mean connectivity for various soft-thresholding powers (β). (c) Dendrogram of genes cluster. Each module was distinguished by different colors. (d) Heat map of the correlation between modules and phenotypic traits of EC. (e) Circos plot of the genes in black, red and blue modules and their co-expression network. (f) Circos plot of the genes with significant differences in survival analysis in TCGA.
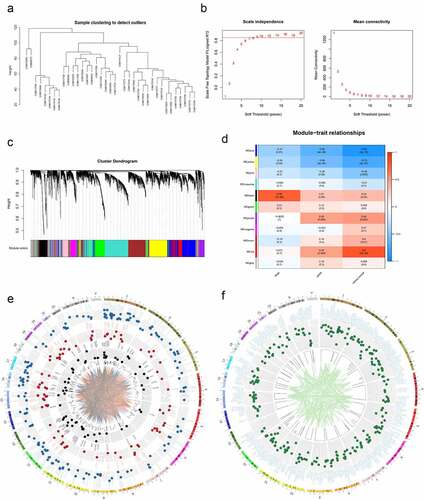
Figure 2. Bioinformatics analysis targets MLLT11-TRIL and PI3K/AKT/mTOR signaling pathway. (a)The Venn diagram of the gene pairs involved in and F. (b) Scatter plot of MLLT11 and TRIL expression in TCGA database. (c) Overall survival of MLLT11 based on Kaplan–Meier plotter with a 95% confidence interval. (d) Overall survival of TRIL based on Kaplan–Meier plotter with a 95% confidence interval. (e) The genes in the black, red and blue modules were enriched in two aspects: “KEGG” and “WikiPathways”, and displayed on the Radar charts.
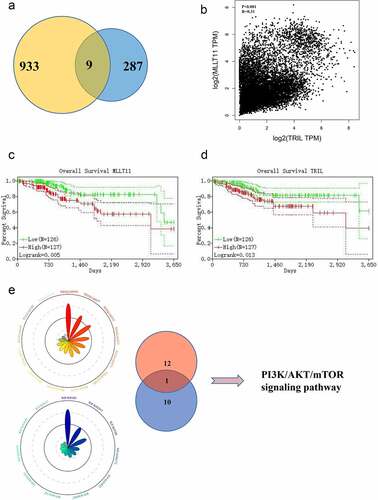
Figure 3. Cell line screening and tissue validation. Western blot was used to detect the expression levels of representative molecules in the PI3K/AKT/mTOR signaling pathway in 8 endometrial cell lines from different sources. (b) MTT assay was used to detect the cell viability of Ishikawa cells at different time points after LY294002, MK-2206 and Rapamycin treatment. *** p < .001. (c) The wound scratch healing assay detected the migration ability of Ishikawa cells at different time points after LY294002, MK-2206 and Rapamycin treatment. ** p < .01 and *** p < .001. (d) The expressions of MLLT11, TRIL and p-AKTThr308 in normal endometrium and endometrial carcinoma were compared by IHC. *** p < .001.
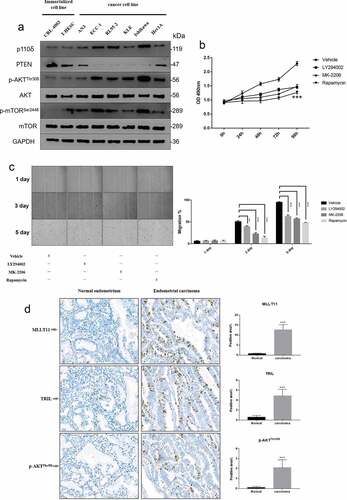
Figure 4. Effects of MLLT11 and TRIL on tumor phenotype. Western blot was performed to verify the effect of siRNA inhibition on the intracellular expression of (a) MLLT11 and (b) TRIL. (c) Suppression of MLLT11 and TRIL at the RNA level by siRNA was determined by qPCR. *** p < .001. Wound scratch healing assay was performed to detect the alteration of migration ability of (d) ECC-1 and (e) Ishikawa cells after MLLT11 and TRIL inhibition by siRNA. *** p < .001. (f) Flow cytometry was used to detect the effect of apoptosis rate after inhibition of MLLT11, TRIL, and combined inhibition of MLLT11 and TRIL by siRNA, respectively, in ECC-1 and Ishikawa cells. (g) The photo of nude mice tumor tissues in the lentivirus knockdown MLLT11, TRIL and MLLT11-TRIL co-knockdown groups (Lv/sh-MLLT11, Lv/sh-TRIL and Lv/sh-M + T) and its control group (Lv/sh-scramble). (h) Line graphs of tumor size of nude mice in the MLLT11, TRIL, MLLT11-TRIL co-knockdown and Lv/sh-scramble groups at different time points.
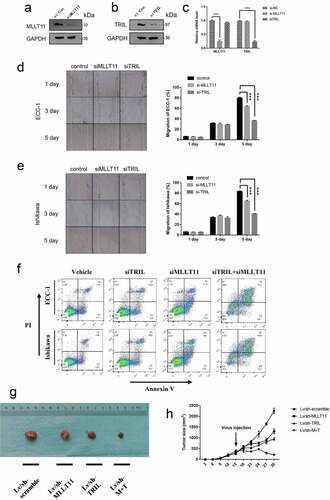
Figure 5. Interaction between the MLLT11-TRIL and PI3K/AKT/mTOR signaling pathway. Western blot was used to detect the effects of LY294002, MK-2206 and Rapamycin on the protein expression of MLLT11 and TRIL in cells. (b) Western blot was used to detect the effects of 740Y-P and IGF-1 on the protein expression of MLLT11 and TRIL in cells. (c) Isolation of nuclear and cytoplasmic proteins to examine the effects of LY294002 and IGF-1 on the subcellular distribution of MLLT11 and TRIL. Co-IP detected the interaction between cell endogenous protein MLLT11 and TRIL. The immunoprecipitates were immunoblotted (IB) with TRIL (d) or MLLT11 (e) antibody.
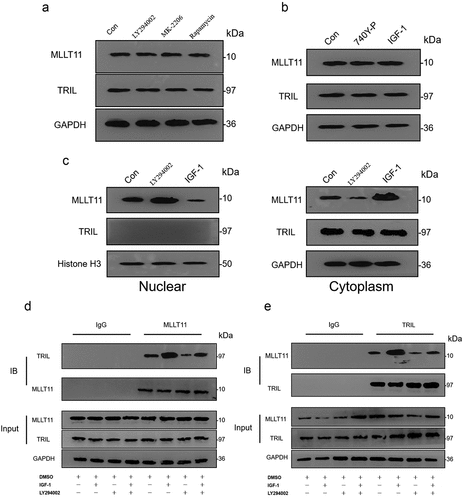
Figure 6. Co-IP detected the interaction between MLLT11-TRIL and AKT. The cell lysate was immunoprecipitated with IgG, MLLT11 (a) or TRIL (b) antibody. And immunoprecipitates were immunoblotted (IB) with pan-AKT antibody. After IGF-1 treated the cells, the above experiment was repeated. The immunoprecipitates were immunoblotted with pan-AKT antibody. The control group was treated with DMSO.
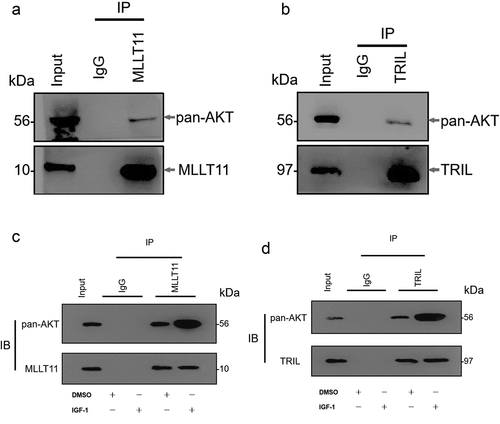
Figure 7. Protein modeling, molecular docking and molecular dynamics simulation. The 3D protein ribbon structure models of (a) MLLT11, (b) TRIL and (c) AKT. (d-e) The 3D surface structure model schematic diagrams of docking between MLLT11(green)-TRIL(cyan) and AKT (violet). (f) The 2D Ligplot represented the interaction site and force between MLLT11-TRIL and AKT. (g) RMSD comparison of wild-type and phosphorylated protein. (h) Complex structure after 50 ns (green for wild-type and blue for phosphorylated protein). (i) Comparison of wild-type and phosphorylated protein RMSF in molecular dynamics process. (j) Comparison of wild-type and phosphorylated protein gyration radius.
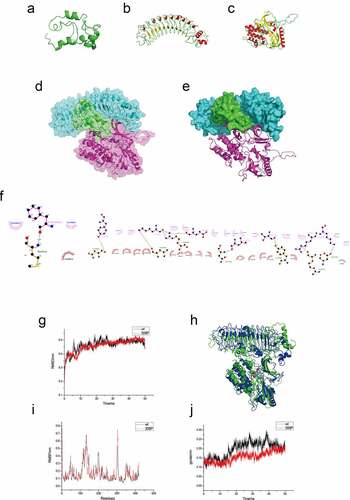
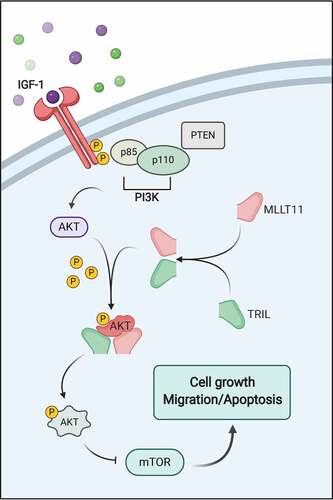
Figure 8. The schematic diagram of MLLT11-TRIL’s involvement in PI3K/AKT/mTOR signaling pathway.
Supplemental Material
Download PDF (275.6 KB)Data availability statement
The data that support the findings of this study are openly available in the MERAV (MERAV, http://merav.wi.mit.edu) database and the TCGA data portal (https://tcga-data.nci.nih.gov/tcga/). All other data are available from the authors upon reasonable request.