
Figures & data
Figure 1. YARS2 was overexpressed in CRC tissues. (a) Overexpression of YARS2 mRNA in CRC tissues than normal tissues by RT-PCR analysis from local database in authors’ institute. (b) Detection of YARS2 mRNA expression in CRC tissues and adjacent non-tumor tissues collected from 10 patients with stage III colorectal adenocarcinoma. The expression levels of YARS2 were normalized to those of β-actin (**, P < .01), n = 10.
Figure 2. Knockdown of YARS2 inhibited CRC cell proliferation and migration, and sensitized cells to 5-FU treatment. (a) Western blot analysis of YARS2 protein in the lysates of either the untreated cells (C, control) or the cells transfected with a non-silencing shRNA (NS, scrambled sequence) or transfected with a specific YARS2 shRNA (shRNA). ACTIN, β-actin expression was used as a loading control. (b) The optical density was determined using NIH ImageJ software. The ratio of YARS2 expression to B-ACTIN expression was determined and normalized. (c) CCK8 assay results showing the effect of reduced expression of YARS2 on growth in SW620 cells compared to that of controls. (d) Transwell migration assay of SW620 cells for 24 hours. (e) Apoptotic ratios of SW620 cells before or after 5-FU treaments were determined by flow cytometry. Data are expressed as means ± SD. *, P < .05; **, P < .01, n = 3.
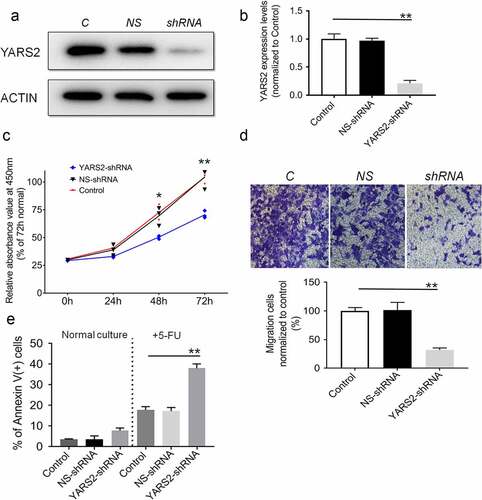
Figure 3. Northern-blot analysis of mitochondrial tRNA in three group of SW620 cells. (a) Equal amounts of total mtRNA samples from the three group of cells were adopted, electroblotted and hybridized with specific oligonucleotide probes for tRNA Tyr, tRNA Lys, tRNA Leu26262626262423222121, and 5S RNA, respectively. (b) Quantification of the tRNA levels were performed. The values are normalized to the control cells. Data are expressed as means ± SD. **, P < .01, n = 3.
Figure 4. Determination of mitochondrial protein levels by Western blot assay. (a) Representative Western blot that hybridized with mitochondrial respiratory complex subunits of SW620 cells. TOM20 was adopted as loading control. MT-ND1, MT-ND4, MT-ND5 and MT-ND6 belong to subunit of complex I; MT-CO2 belongs to subunit of complex IV; MT-CYTB belongs to subunit of complex III. (b) Quantification of mitochondrial protein levels. The optical density was determined using NIH ImageJ software. The values are expressed as percentages of the average values for the control cells. Data are expressed as means ± SD. *, P < .05; **, P < .01, n = 3.
Figure 5. Seahorse Flux Analyzer bioenergetics analysis of YARS2 knockdown cells illustrates significant reduction in respiration. (a) Representative graph of the oxygen consumption rate (OCR). Oligomycin (1.5 μM), carbonyl cyanide p-(trifluoromethoxy)phenylhydrazone (FCCP) (0.5 μM), rotenone (1 μM) and antimycin A (1 μM) were added at indicated times to determine different parameters of mitochondrial functions. (b)The average basal OCR, ATP-linked production, proton leakage, maximal OCR, reserve respiratory capacity, as well as non-mitochondrial production were determined. Data are expressed as means ± SD. **, P < .01, n = 3.
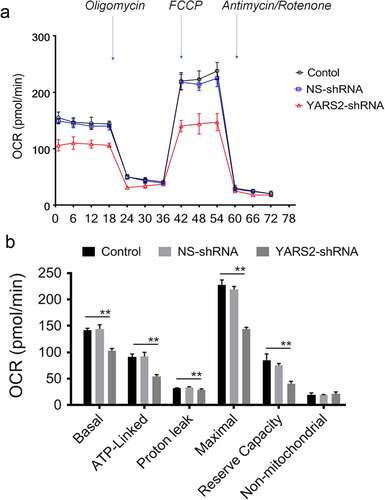
Figure 6. Determination of ATP and ROS levels in SW620 cells. (a) YARS2 knockdown cells exhibited significantly reduced mitochondrial ATP levels. (b) Relative levels of ROS production. Data are expressed as means ± SD. *, P < .05, n = 3.
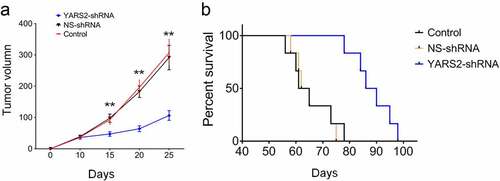
Figure 7. YARS2 knockdown SW620 cells showed reduced progression in mice model. (a) Total tumor volume at 10, 15,20, and 25 days after the implantation of CRC cells. (b) Kaplan-Meier plot of overall survival of pelvic recurrence model. Data are expressed as means ± SD. **, P < .01, n = 8.
Supplemental Material
Download Zip (2 MB)Data availability statement
The data of this study are available from the corresponding author upon reasonable request.