Figures & data
Figure 1. The phenotypes of abnormal heart tube formation following treatment with high glucose. (A) A cartoon illustrating that the fertilized chick eggs were incubated in the presence of mannitol (control) or 50 mM glucose (high glucose) until the embryos reached HH11 stage. (B-B2) VMHC in situ hybridization was performed in HH11 control embryos (B). A high-magnification image focused on the developing heart tube (B1). The corresponding level of transverse section was indicated by the white dotted line in B1 (B2). (C-C2) MF-20 fluorescence immunostaining was performed in HH11 control embryos. C and C1 are bright-field and fluorescence images, respectively. C2 is the high-magnification image focused on the developing heart tube. (D-D2) VMHC in situ hybridization was performed in HH11 high-glucose-treated embryos (D). D1 is the high-magnification image focused on the developing heart tube. D2 is the transverse section at the level indicated by the white dotted line in D1. (E-E2) MF-20 fluorescence immunostaining was performed in HH11 high-glucose-treated embryos. E and E1 are bright-field and fluorescence images, respectively. E2 is the high-magnification image focused on the developing heart tube. (F-F3) MF-20 fluorescence immunostaining was performed in HH11 high-glucose-treated embryos. F and F1 are bright-field and fluorescence images, respectively. F2 is the high-magnification image focused on the developing heart tube. F3 is the transverse section at the level indicated by the white dotted line in F2. (G) Bar chart showing the frequency of heart tube hypertrophy. (H) Bar chart showing the frequency of dextrocardia. (I) Bar chart showing the frequency of heart tube fusion anomaly. Abbreviations: Ctr, control and HG, high glucose. Scale bars = 500 μm in B, C-C1, D-D1, E-E1 and F-F1; 100 μm in B1, C2, D1, E2, F2; 100 μm in B2, D2, F3.
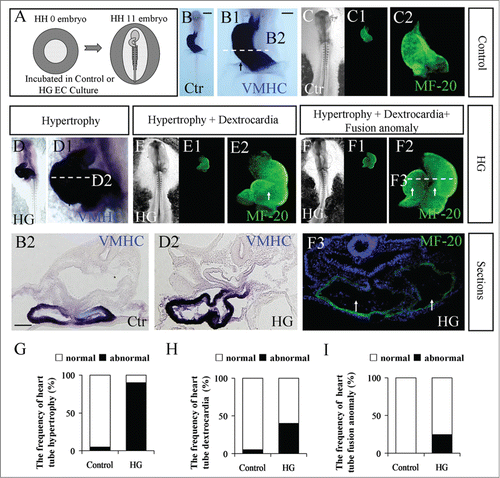
Figure 2. The treatment of high glucose sped up mesoderm cell migration during gastrulation. A piece of GFP+ anterior primitive streak tissue was transplanted into the same position in un-transfected HH3+ host embryos, and the embryos were further cultured in high glucose (left-side embryo) and mannitol (right-side embryo) (see the detail in Material and Method) for 20 hours. (A–C) Fluorescence images were taken at incubation 0 hour (A), 10 hour (B) and 20 hour (C), respectively. (D) High-magnification image indicated by the white dotted line square in C. (A1-C1) The merge image of bright-field and fluorescence at incubation 0 hour (A1), 10 hour (B1) and 20 hour (C1), respectively. (D1) High-magnification image indicated by the white dotted line square in C1. (E) The sketch illustrates that there are more red dotted lines on the high-glucose side (left), indicating that high glucose promoted mesoderm cell migration. (F-G2) Transverse sections of GFP-positive cells (F and G), BrdU staining (F1 and G1) and the merge of GFP and BrdU (F2 and G2) of HH5 or HH8 embryo. (H) Bar chart showing the comparison of GFP+ mesoderm cell number between control and high-glucose-treated sides (paired T pest). (I and J) Bar chart showing the comparison of BrdU+ mesoderm cell number between control and high-glucose-treated sides of HH5 or HH8 embryo (paired T pest). (K-K2) RT-PCR showing the expression of RhoA and Cyclin D1 after treatment with high glucose. The RT-PCR result was the representative of 4 independent experiments (independent samples T test). Abbreviations: Ctr, control and HG, high glucose. Scale bars = 500 μm in A-C, A1-C1; 200 μm in D-D1; 100 μm in F-F2 and 100 μm in G-G2.
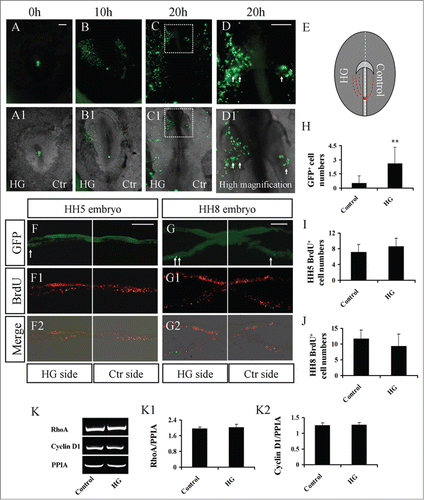
Figure 3. Exposure of high glucose promoted autophagy in gastrula chick embryos. (A and B) The LC3B fluorescence immunostaining was performed in primary cell culture from either control (A-A1) or RAPA-treated (B-B1) embryos. A1 and B1 are merged images with DAPI staining, respectively. (C and D) Atg7 fluorescence immunostaining was performed in HH8 (C) and HH10 (D) chick embryos. High-magnification images at the cranial region are on the right corner of C and D. (C1-C2) Transverse sections at the level indicated by the white dotted line in C. C1 is Atg7 fluorescence staining only, and C2 is the merger of DAPI and C1. (D1-D2) Transverse sections at the level indicated by the white dotted line in D. D1 is Atg7 fluorescence staining only, and D2 is the merger of DAPI and D1. Abbreviations: HG, high glucose. Scale bars = 10 μm in A-B1; 500 μm in C and D; 100 μm in C1-C2; 50 μm in D1-D2.
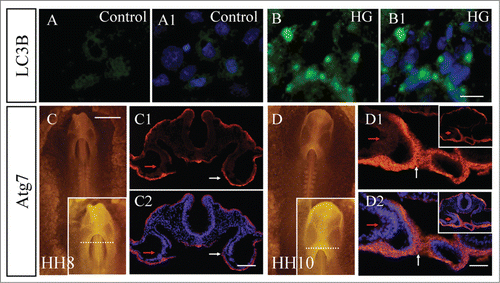
Figure 4. Interference of autophagy obstructed chick heart tube fusion. (A-A1) MF-20 fluorescence immunostaining was performed in control and RAPA-treated embryos. A is the image of bright-field, and A1 is fluorescence immunostaining. A high-magnification image focused on a heart tube is in the right corner of A1. (B) A cartoon illustrating that autophagy was graphically activated by RAPA or inhibited by 3-MA in gastrula chick embryos. (C–H) The combination of GFP+ anterior primitive streak grafts with the exposure of either RAPA or 3-MA in gastrula chick embryos. (C–E) Fluorescence images were taken at hour 0 (C), hour 12 (B) and hour 20 (C) of incubation after GFP+ anterior primitive streak transplantation. The left sides of embryos were exposed to 40 nM RAPA, while the right sides were untreated (control). (C1-E1) The merged images of bright-field and A-C, respectively. (F-H) Fluorescence images were taken at hour 0 (C), hour 12 (B) and hour 20 (C) of incubation after GFP+ anterior primitive streak transplantation. The left sides of embryos were exposed to 5 mM 3-MA, while the right sides were untreated (control). (F1-H1) The merged images of bright-field and F-H, respectively. (I) The sketch illustrates that there are less red dotted lines on the 3-MA+HG-treated side (left) in comparison to the PBS+HG-treated side of embryos. (J-L) Fluorescence images were taken at hour 0 (C), hour 12 (B) and hour 20 (C) of incubation after DiI-labeled primitive streak transplantation. The left sides of embryos were exposed to 3-MA+HG, while the right sides were to PBS+HG. (J1-L1) The merged images of bright-field and F-H, respectively. (M-P) Fluorescence images were taken at hour 0 (C), hour 12 (B) and hour 20 (C) of incubation after DiI-labeled primitive streak transplantation. The left sides of embryos were exposed to CQ+HG, while the right sides were to PBS+HG. (N1-P1) The merged images of bright-field and N-P, respectively. Abbreviations: Ctr, control and HG, high glucose. Scale bars =500 μm in A-A1, C-K1, L-L1 and N-P1.
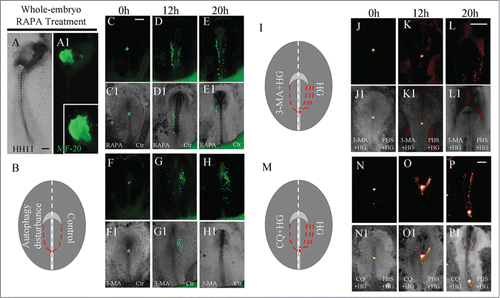
Figure 5. The exposure of embryos to high glucose or RAPA blocked gene expression in progenitors of the heart tube. (A and B): BMP2 in situ hybridization was performed in embryos exposed on one side to high glucose (A). A1 and A2 are high-magnification images from the sites indicated by dotted squares in A. (B) is the transverse section at the level indicated by the dotted line in A. (C and D) GATA5 in situ hybridization was performed in embryos exposed on one side to high glucose (C). C1 and C2 are high-magnification images from the sites indicated by dotted squares in C. (D) is the transverse section at the level indicated by the dotted line in C. (E–E3) RT-PCR data showing the mRNA expression of BMP2, Nkx-2.5 and GATA4 after treatment with high glucose. The RT-PCR result was the representative of 4 independent experiments. **p<0.01 and ***p<0.001 indicating statistically significant differences between high-glucose-treated and control embryos (independent samples T test). (F and G) GATA5 in situ hybridization was performed in the embryos with one side exposed to RAPA (F). F1 and F2 are high-magnification images from the sites indicated by dotted squares in F. G is the transverse section at the level indicated by dotted line in F. Abbreviations: Ctr, control and HG, high glucose. Scale bars = 200 μm in A, C, F; 100 μm in A1-A2, C1-C2, F1-F2; 100 μm in B and D, G.
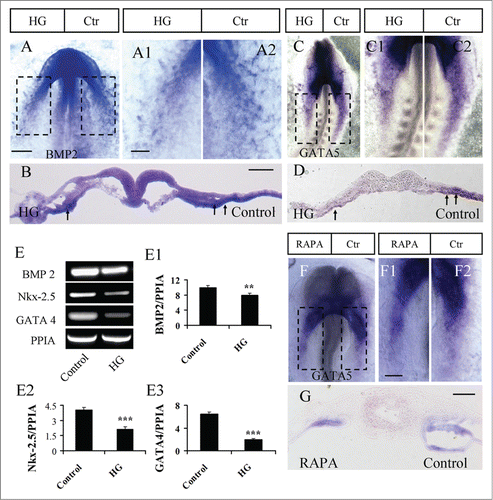
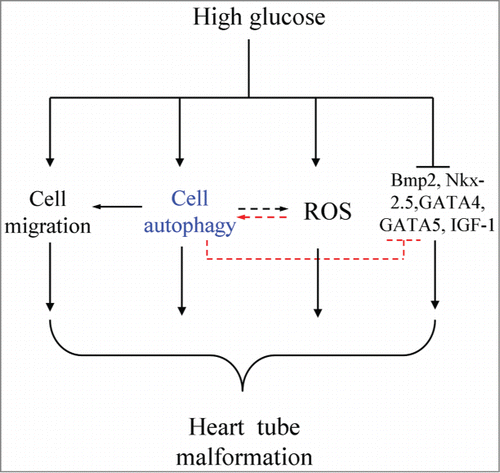
Figure 6. Model depicting the hypothesis for high-glucose-induced malformations of heart tubes. High glucose might cause the autophagic disturbance, abnormal cell migration, promoted ROS of the cardiac progenitors, heart tube formation-related gene expression, including BMP2, Nkx-2.5, GATA4 and GATA5, was also adversely influenced. It is well known that the excess ROS also can induce the autophagy even we did not prove it in this study. In sum, we suggested that excess cell autophagy induced by high glucose is the key factor for the heart tube malformation development.