
Figures & data
Figure 1. Characterization of bortezomib-resistant MM cell lines, and primary relapsed MM patient samples. (A) The IC50 Log[bortezomib] (nM) of bortezomib-naïve and bortezomib-resistant MM cell lines was analyzed by luminescent cell viability assay. (B) Relative cell viability (5 nM/48 h) and (C) chymotrypsin-like proteasome activity in bortezomib-naïve and bortezomib-resistant MM cell lines in response to (5 nM/4 h) bortezomib. (D) Relative cell viability of primary naïve and primary relapsed MM patient samples in response to bortezomib (5 nM/24 h). Statistical significance between treatments was calculated by Student's t test; * indicates P ≤ 0.05. Statistical significance between cohorts was calculated by ANOVA; # indicates P ≤ 0.05.
![Figure 1. Characterization of bortezomib-resistant MM cell lines, and primary relapsed MM patient samples. (A) The IC50 Log[bortezomib] (nM) of bortezomib-naïve and bortezomib-resistant MM cell lines was analyzed by luminescent cell viability assay. (B) Relative cell viability (5 nM/48 h) and (C) chymotrypsin-like proteasome activity in bortezomib-naïve and bortezomib-resistant MM cell lines in response to (5 nM/4 h) bortezomib. (D) Relative cell viability of primary naïve and primary relapsed MM patient samples in response to bortezomib (5 nM/24 h). Statistical significance between treatments was calculated by Student's t test; * indicates P ≤ 0.05. Statistical significance between cohorts was calculated by ANOVA; # indicates P ≤ 0.05.](/cms/asset/2f7f835c-59ff-4b63-ab44-a8698e61f480/kccy_a_998067_f0001_b.gif)
Figure 2. Enhanced BTK activity in bortezomib-resistant MM cell lines is resistant to inhibition with bortezomib. (A) Representative immunocytochemistry of basal levels of total and phosphorylated BTK (pBTK) in bortezomib-naïve and bortezomib-resistant U266 MM cells with DAPI nuclear staining [left panel] and subsequent quantification of basal pBTK/total BTK (%) staining intensity [right panel]. Box and whisker indicates the mean ± SEM (n ≥ 80). (B) qRT-PCR analysis of BTK mRNA following bortezomib (5 nM/4 h) exposure in bortezomib-naïve and bortezomib-resistant U266 MM cells relative to GAPDH. Values indicate the mean ± SEM from 3 independent experiments. (C) Representation of wild type pGL4.BTK promoter-luciferase vector [including κB binding sites] transfected into bortezomib-naïve and bortezomib-resistant U266 MM cells. (D) Luciferase activity of pGL4.BTK promoter-luciferase vectors in bortezomib-naïve and bortezomib-resistant U266 MM cells following bortezomib (5 nM/24 h) exposure, normalized by co-transfection with pRL-TK Renilla Luciferase Reporter Vectors. Values indicate the mean ± SEM from 3 independent experiments. Statistical significance between treatments was calculated by Student's t test; * indicates P ≤ 0.05. Statistical significance between cohorts was calculated by ANOVA; # indicates P ≤ 0.01.
![Figure 2. Enhanced BTK activity in bortezomib-resistant MM cell lines is resistant to inhibition with bortezomib. (A) Representative immunocytochemistry of basal levels of total and phosphorylated BTK (pBTK) in bortezomib-naïve and bortezomib-resistant U266 MM cells with DAPI nuclear staining [left panel] and subsequent quantification of basal pBTK/total BTK (%) staining intensity [right panel]. Box and whisker indicates the mean ± SEM (n ≥ 80). (B) qRT-PCR analysis of BTK mRNA following bortezomib (5 nM/4 h) exposure in bortezomib-naïve and bortezomib-resistant U266 MM cells relative to GAPDH. Values indicate the mean ± SEM from 3 independent experiments. (C) Representation of wild type pGL4.BTK promoter-luciferase vector [including κB binding sites] transfected into bortezomib-naïve and bortezomib-resistant U266 MM cells. (D) Luciferase activity of pGL4.BTK promoter-luciferase vectors in bortezomib-naïve and bortezomib-resistant U266 MM cells following bortezomib (5 nM/24 h) exposure, normalized by co-transfection with pRL-TK Renilla Luciferase Reporter Vectors. Values indicate the mean ± SEM from 3 independent experiments. Statistical significance between treatments was calculated by Student's t test; * indicates P ≤ 0.05. Statistical significance between cohorts was calculated by ANOVA; # indicates P ≤ 0.01.](/cms/asset/f410d49a-dfc3-41ec-9b5a-7f580c1a3ae0/kccy_a_998067_f0002_c.gif)
Figure 3. BTK inhibition enhances sensitivity to bortezomib in bortezomib-naïve and bortezomib-resistant MM cells. (A) Relative cell viability of bortezomib-naïve and bortezomib-resistant MM cell lines 48 h post-ibrutinib 'pulse' treatment. (B) Relative cell viability of bortezomib-naïve and bortezomib-resistant MM cells post-ibrutinib 'pulse' treatment in combination with bortezomib (5 nM/24 h). (C) Relative cell viability of primary naïve and primary relapsed MM patient samples post in vitro ibrutinib 'pulse' treatment in combination with bortezomib (5 nM/24 h). Statistical significance between treatments was calculated by Student's t test; * indicates p ≤ 0.05. Statistical significance between cohorts was calculated by ANOVA; # indicates P ≤ 0.01.
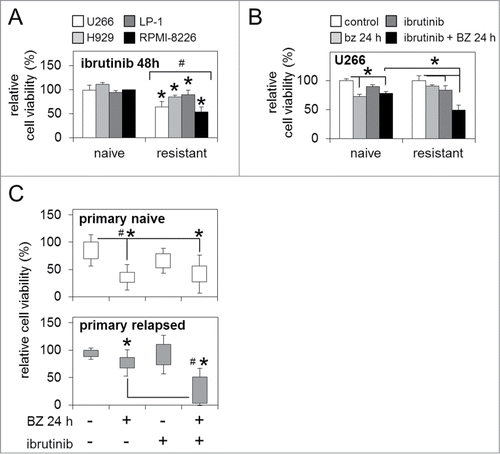
Figure 4. BTK inhibition via lenti-viral miRNA targeting enhances sensitivity to bortezomib in bortezomib-naïve and bortezomib-resistant MM cells. (A) qRT-PCR analysis of basal BTK mRNA expression in bortezomib-naïve and bortezomib-resistant MM U266 cells infected with lenti-viral miRNA constructs targeting BTK (miRBTK) transcription relative to GAPDH. (B) Relative cell viability of bortezomib-naïve and bortezomib-resistant MM U266 cells infected with lenti-viral miRBTK before and after bortezomib treatment (5 nM/24 h). Values indicate the mean ± SEM from 3 independent experiments. Statistical significance between treatments was calculated by Student's t test; * indicates P ≤ 0.05. Statistical significance between cohorts was calculated by ANOVA; # indicates p ≤ 0.01.
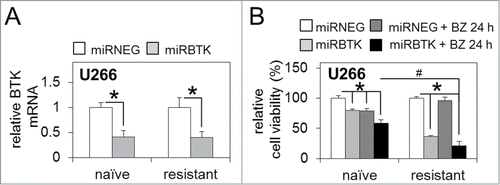
Figure 5. Bortezomib-resistance is driven by enhanced NF-κB p65 activity and can be reversed by BTK inhibition. (A) Quantification of staining intensity of nuclear p65/total NF-κB p65 (%) in bortezomib-naïve and bortezomib-resistant U266 MM cells. Box and whisker indicates the mean ± SEM (n ≥ 20). Statistical significance between cohorts was calculated by ANOVA; # indicates P ≤ 0.01. Inset shows example immunocytochemistry for NF-κB p65. Dotted line indicates nucleus as determined by DAPI staining. (B) Western immunoblot of bortezomib-naïve [N] and bortezomib-resistant [R] U266 nuclear [Nuc.] and cytoplasmic [Cyt.] cell fractions. GAPDH and Histone 3 [H3] show equal loading for cyt. and nuc. fractions, respectively. (C) Quantification of staining intensity of nuclear NF-κB p65/total NF-κB p65 (%) in bortezomib-naïve and bortezomib-resistant U266 MM cells. Box and whisker indicates the mean ± SEM (n ≥ 20). Statistical significance between cohorts was calculated by ANOVA; # indicates p ≤ 0.05. (D) qRT-PCR analysis of basal NF-κB p65 mRNA expression in bortezomib-naïve and bortezomib-resistant MM U266 cells infected with lenti-viral miRNA constructs targeting NF-κB p65 (miRp65) transcription relative to GAPDH. (E) Relative cell viability of bortezomib-naïve and bortezomib-resistant MM U266 cells infected with lenti-viral miRp65 24 h before and after ibrutinib 'pulse' treatment. Values indicate the mean ± SEM from 3 independent experiments. Statistical significance between treatments was calculated by Student's t test; * indicates P ≤ 0.05. Statistical significance between cohorts was calculated by ANOVA; # indicates P ≤ 0.01.
![Figure 5. Bortezomib-resistance is driven by enhanced NF-κB p65 activity and can be reversed by BTK inhibition. (A) Quantification of staining intensity of nuclear p65/total NF-κB p65 (%) in bortezomib-naïve and bortezomib-resistant U266 MM cells. Box and whisker indicates the mean ± SEM (n ≥ 20). Statistical significance between cohorts was calculated by ANOVA; # indicates P ≤ 0.01. Inset shows example immunocytochemistry for NF-κB p65. Dotted line indicates nucleus as determined by DAPI staining. (B) Western immunoblot of bortezomib-naïve [N] and bortezomib-resistant [R] U266 nuclear [Nuc.] and cytoplasmic [Cyt.] cell fractions. GAPDH and Histone 3 [H3] show equal loading for cyt. and nuc. fractions, respectively. (C) Quantification of staining intensity of nuclear NF-κB p65/total NF-κB p65 (%) in bortezomib-naïve and bortezomib-resistant U266 MM cells. Box and whisker indicates the mean ± SEM (n ≥ 20). Statistical significance between cohorts was calculated by ANOVA; # indicates p ≤ 0.05. (D) qRT-PCR analysis of basal NF-κB p65 mRNA expression in bortezomib-naïve and bortezomib-resistant MM U266 cells infected with lenti-viral miRNA constructs targeting NF-κB p65 (miRp65) transcription relative to GAPDH. (E) Relative cell viability of bortezomib-naïve and bortezomib-resistant MM U266 cells infected with lenti-viral miRp65 24 h before and after ibrutinib 'pulse' treatment. Values indicate the mean ± SEM from 3 independent experiments. Statistical significance between treatments was calculated by Student's t test; * indicates P ≤ 0.05. Statistical significance between cohorts was calculated by ANOVA; # indicates P ≤ 0.01.](/cms/asset/6d6ddcc8-f276-4df1-bfe4-8eec8fb2dc13/kccy_a_998067_f0005_b.gif)