1,577
Views
29
CrossRef citations to date
0
Altmetric
Report

MicroRNA-215 Regulates Fibroblast Function: Insights from a Human Fibrotic Disease

, &
Pages 1973-1984 | Received 13 Oct 2014, Accepted 09 Dec 2014, Published online: 17 Jun 2015

Figures & data

Table 1. MicroRNAs dysregulated in pterygium, presented as fold change over conjunctiva levels (microarray data).

Figure 1. (A) Bar chart showing results of the Exiqon microRNA Array. Height of the bars shows the mean normalized log values of miR-215 levels in conjunctiva and pterygium tissues from different patients. (B) Bar chart showing individual and overall results from qRT-PCR assay performed on 3 separate pairs of human pterygium and conjunctival tissues. Height of the bars represents the relative fold change of miR-215 levels in pterygium with respect to conjunctival control. Error bars represent standard error of mean. Values are normalized to the 5S rRNA control values. (C) miR-215 in situ staining of human pterygium and conjunctival tissues. Diagram on the right showing conjunctival epithelium and some stroma. Pterygium and conjunctival sections hybridized with DIG-labeled miR-215 LNA probes (red). DNA was counterstained with DAPI (blue). Scale bar represents 100 μm. Dashed lines represent position of basement membrane separating epithelium from stroma.
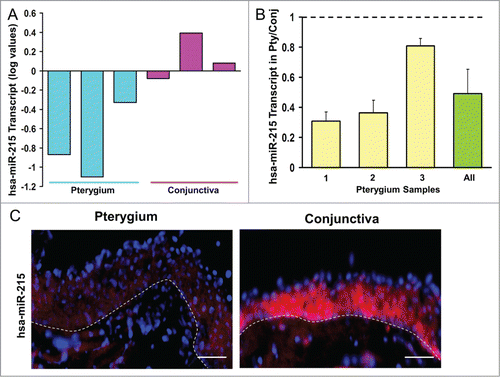
Figure 1. (A) Bar chart showing results of the Exiqon microRNA Array. Height of the bars shows the mean normalized log values of miR-215 levels in conjunctiva and pterygium tissues from different patients. (B) Bar chart showing individual and overall results from qRT-PCR assay performed on 3 separate pairs of human pterygium and conjunctival tissues. Height of the bars represents the relative fold change of miR-215 levels in pterygium with respect to conjunctival control. Error bars represent standard error of mean. Values are normalized to the 5S rRNA control values. (C) miR-215 in situ staining of human pterygium and conjunctival tissues. Diagram on the right showing conjunctival epithelium and some stroma. Pterygium and conjunctival sections hybridized with DIG-labeled miR-215 LNA probes (red). DNA was counterstained with DAPI (blue). Scale bar represents 100 μm. Dashed lines represent position of basement membrane separating epithelium from stroma.

Figure 2. (A) Real-time cell impedance index measured using the xCELLigence cell impedance system. Cells are transfected with 100 nM miR-215 mimic (red) or non-specific oligonucleotide control (blue) and medium changed at 6 h. Error bars show standard deviation across 3 biological samples in 3 separate experimental replicates. (B) Bar chart representing cell indices of miR-215 or control-transfected cells as described above at various time points after changing medium. Error bars show standard deviation across 3 biological samples in 3 separate experimental replicates.
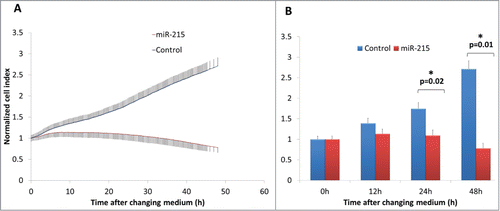
Figure 2. (A) Real-time cell impedance index measured using the xCELLigence cell impedance system. Cells are transfected with 100 nM miR-215 mimic (red) or non-specific oligonucleotide control (blue) and medium changed at 6 h. Error bars show standard deviation across 3 biological samples in 3 separate experimental replicates. (B) Bar chart representing cell indices of miR-215 or control-transfected cells as described above at various time points after changing medium. Error bars show standard deviation across 3 biological samples in 3 separate experimental replicates.

Figure 3. Cell proliferation was analyzed using the Click-it EdU Alexa Fluor 488 (Life Technologies, Carlsbad, CA, USA) assay according to the manufacturer′s protocol. Pterygium fibroblast cells reverse-transfected with miR-215 mimic or non-specific oligonucleotide control and 10 uM of 5-ethynyl-2′-deoxyuridine (EdU) added and incubated for 10 h. (I), Cells transfected with miR-215 for 24 h, (J) cells transfected with control for 24 h, (K), cells transfected with miR-215 for 48 h, (L), cells transfected with control for 48 h; (E), (F), (G), (H), DAPI fluorescence only, for the same cells in (I)-(L), respectively; (A), (B), (C), (D), Alexa-Fluor 488 fluorescence only. Images shown are representative of 3 experiments. Scale bar represents 100 uM.
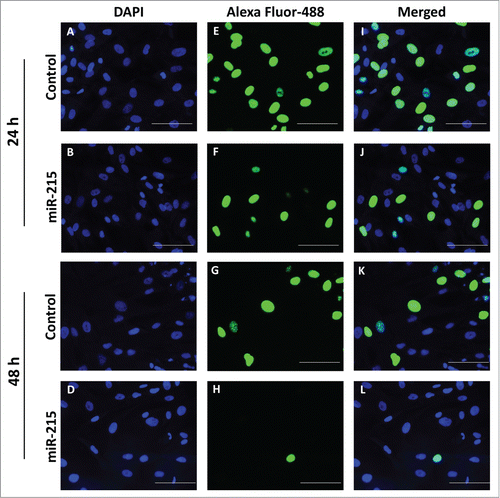
Figure 3. Cell proliferation was analyzed using the Click-it EdU Alexa Fluor 488 (Life Technologies, Carlsbad, CA, USA) assay according to the manufacturer′s protocol. Pterygium fibroblast cells reverse-transfected with miR-215 mimic or non-specific oligonucleotide control and 10 uM of 5-ethynyl-2′-deoxyuridine (EdU) added and incubated for 10 h. (I), Cells transfected with miR-215 for 24 h, (J) cells transfected with control for 24 h, (K), cells transfected with miR-215 for 48 h, (L), cells transfected with control for 48 h; (E), (F), (G), (H), DAPI fluorescence only, for the same cells in (I)-(L), respectively; (A), (B), (C), (D), Alexa-Fluor 488 fluorescence only. Images shown are representative of 3 experiments. Scale bar represents 100 uM.

Figure 4. Results of the cell cycle analysis: Cultured primary pterygium fibroblast cells were reverse-transfected with 100 nM miR-215 mimic or non-specific control oligonucleotide for 48 h, and arrested at G1 and G2 phases by blocking with 2 ug/mL aphidicolin or 100 ng/mL nocodazole respectively. Eighteen hours after drug treatment, cells were collected for cell cycle analysis using flow cytometry. (A and B) Cluster bar chart showing percentage of cells arrested at G1, S and G2, for miR-215 (A) or random oligonucleotide control (B) transfected cells treated with aphidicolin (green), or nocodazole (red). Non-treated controls are shown in blue. Numbers represent mean of 3 experiments ± standard deviation C. Histograms illustrate proportions of cells observed at different phases: the first peak corresponds to G1 and second peak G2. The histogram is extracted from one representative experiment from a series of 3 biological replicates.
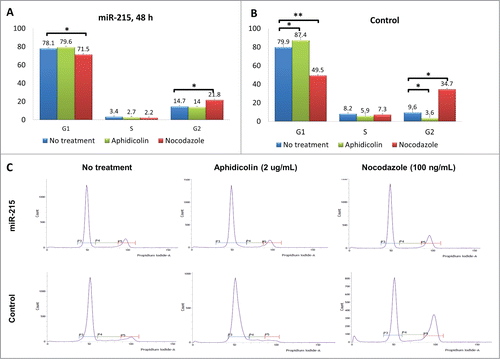
Figure 4. Results of the cell cycle analysis: Cultured primary pterygium fibroblast cells were reverse-transfected with 100 nM miR-215 mimic or non-specific control oligonucleotide for 48 h, and arrested at G1 and G2 phases by blocking with 2 ug/mL aphidicolin or 100 ng/mL nocodazole respectively. Eighteen hours after drug treatment, cells were collected for cell cycle analysis using flow cytometry. (A and B) Cluster bar chart showing percentage of cells arrested at G1, S and G2, for miR-215 (A) or random oligonucleotide control (B) transfected cells treated with aphidicolin (green), or nocodazole (red). Non-treated controls are shown in blue. Numbers represent mean of 3 experiments ± standard deviation C. Histograms illustrate proportions of cells observed at different phases: the first peak corresponds to G1 and second peak G2. The histogram is extracted from one representative experiment from a series of 3 biological replicates.

Figure 5. Fluorescent immunostaining images of conjunctiva (first and third column) and pterygium (second and fourth column) tissues using primary antibodies against ICK (E and F), TRIP13 (G and H), CDC25A (I and J), DICER1 (K and L), MCM10 (M and N), MCM3 (O and P), followed by Alexa Fluor-488 conjugated secondary antibodies. Conjunctiva and pterygium tissues which were stained with only secondary antibodies (A–D) were used as negative controls for each primary antibody used. Dicer1: dicer 1, ribonuclease type III, Mcm3: minichromosome maintenance complex component 3, Cdc25A: cell division cycle 25A, Mcm10: minichromosome maintenance complex component 10, Trip13: thyroid hormone receptor interactor 13, Ick: intestinal cell (MAK-like) kinase.
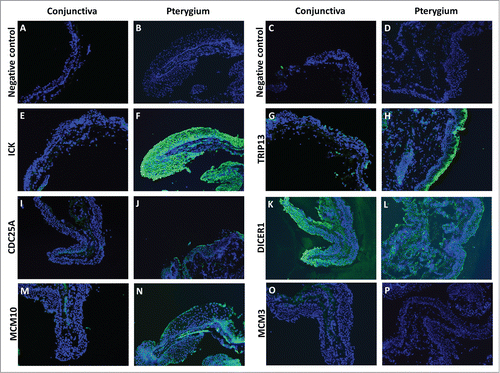
Figure 5. Fluorescent immunostaining images of conjunctiva (first and third column) and pterygium (second and fourth column) tissues using primary antibodies against ICK (E and F), TRIP13 (G and H), CDC25A (I and J), DICER1 (K and L), MCM10 (M and N), MCM3 (O and P), followed by Alexa Fluor-488 conjugated secondary antibodies. Conjunctiva and pterygium tissues which were stained with only secondary antibodies (A–D) were used as negative controls for each primary antibody used. Dicer1: dicer 1, ribonuclease type III, Mcm3: minichromosome maintenance complex component 3, Cdc25A: cell division cycle 25A, Mcm10: minichromosome maintenance complex component 10, Trip13: thyroid hormone receptor interactor 13, Ick: intestinal cell (MAK-like) kinase.
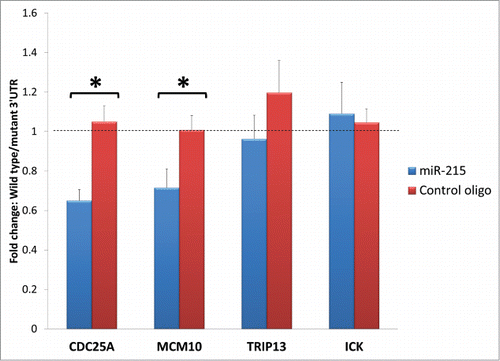
Figure 6. Bar charts represent fold change difference in luciferase activity when HEK293T cells are transfected with wild type 3′ UTR or mutant 3′ UTR. Wild type Cdc25A and Mcm10 show a marked reduction in luciferase activity compared to their mutant control (illustrated as fold change with blue bars) but this reduction is abolished when miR-215 mimic is substituted for random oligonucleotide control (illustrated as fold change with red bars), highlighting specificity of miR-215 to binding sites on Cdc25A and Mcm10. No significant changes were observed for Trip13 and Ick. Cdc25A: cell division cycle 25A, Mcm10: minichromosome maintenance complex component 10, Trip13: thyroid hormone receptor interactor 13, Ick: intestinal cell (MAK-like) kinase.

Figure 6. Bar charts represent fold change difference in luciferase activity when HEK293T cells are transfected with wild type 3′ UTR or mutant 3′ UTR. Wild type Cdc25A and Mcm10 show a marked reduction in luciferase activity compared to their mutant control (illustrated as fold change with blue bars) but this reduction is abolished when miR-215 mimic is substituted for random oligonucleotide control (illustrated as fold change with red bars), highlighting specificity of miR-215 to binding sites on Cdc25A and Mcm10. No significant changes were observed for Trip13 and Ick. Cdc25A: cell division cycle 25A, Mcm10: minichromosome maintenance complex component 10, Trip13: thyroid hormone receptor interactor 13, Ick: intestinal cell (MAK-like) kinase.
Supplemental material

998077_Supplementary_Materials.zip

Download Zip (78.5 KB)

Reprints and Corporate Permissions

Please note: Selecting permissions does not provide access to the full text of the article, please see our help page How do I view content?

To request a reprint or corporate permissions for this article, please click on the relevant link below:

Academic Permissions

Please note: Selecting permissions does not provide access to the full text of the article, please see our help page How do I view content?

Obtain permissions instantly via Rightslink by clicking on the button below:

If you are unable to obtain permissions via Rightslink, please complete and submit this Permissions form. For more information, please visit our Permissions help page.