Figures & data
Figure 1. Organizing Center dynamics within the O. dioica coenocyst. Stages pre- (P3) and post- (P4) selection of meiotic nuclei (MeN) to populate growing pro-oocytes (P3/4, phase 3/4; (see refs. 6,7,28) were assessed. A) MPM-2 immunofluorescence reveals cytoplasmic organizing centers (OC) within the coenocyst. Figure represents confocal stack Z-projections with a depth of 3 μm. Arrowheads indicate points of reference in B. Scale bars = 25 μm. B) Scatter plot of OCs and meiotic nuclei XY coordinates (in μm) through confocal Z stack (depths displayed for each stack) reveal that OCs (stained by MPM-2 antibody) were juxtaposed to meiotic nuclei in the coenocyst prior to oocyte selection. In P4, the close juxtaposition of OCs to meiotic nuclei was reduced, though it was preferentially retained in meiotic nuclei selected to seed growing oocytes (H3-pS28 positive). OC, organizing center; MN, meiotic nuclei, MN non-sel, meiotic nuclei not selected to populate growing oocytes. C) The total number of OCs coincided with the number of meiotic nuclei, indicating that terminally differentiated endocycling nurse nuclei (NN) did not retain a juxtaposed OC. MN-selected, meiotic nuclei selected to populate growing oocytes. D) Graphical representation of measured distances between meiotic nuclei and proximal OCs confirms that OC proximity is reduced in non-selected nuclei.
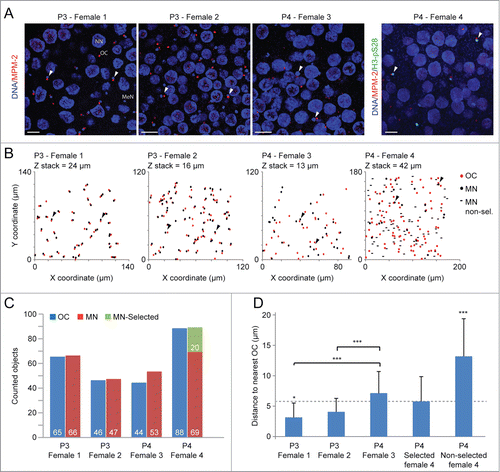
Figure 2. Ultrastructure of the O. dioica germline. (A) Day 5 male mitotic germline nuclei (MiN) are each associated with an MTOC that possesses a pair of centrioles (Ce). (B) Centrioles were not observed within female P3 ovaries. Meiotic nuclei (MeN) possessed nuclear membranes containing nuclear pore complexes (NPC). Golgi apparati were observed in proximity to the nuclear membrane. An electron dense structure of similar size to meiotic nuclei was observed in contact with the nuclear envelope, consistent with the immunofluorescent staining () of acentriolar OCs. NPCs were observed at the OC/MN interface. (C) OCs were surrounded by endoplasmatic reticulum (ER). M, mitochondria; MVE, multi-vesicular endosome-like structure. (D) Electron dense regions resembling 3 parallel lines, with 100 nm gaps between the central and flanking lines, were observed, consistent with the structure of synaptonemal complexes (SCs). Scale bars in μm.
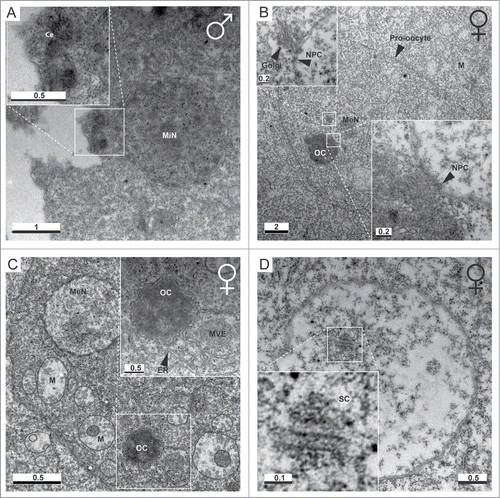
Figure 3. Kinase activity at OCs and rearrangement of the nuclear envelope of meiotic nuclei. (A) Activation of the MAPK pathway and phosphorylation of meiotic substrates occurs at OCs, analogous to MTOCs (gamma-tubulin staining), as indicated by pERK1/2 and MPM-2 stainings, respectively. MeN, meiotic nucleus; NN, nurse nucleus. (B) OCs are positioned toward the vegetal pole of pro-oocytes, opposite clustered nuclear pore complexes (NPCs) at the animal pole in P3.Citation7 In selected pro-oocyte meiotic nuclei (S-MeN), NPCs form clusters at the OC-nucleus interface at P4. Non-selected meiotic nuclei (N-MeN) associate with nurse nuclei, along with OCs which localize within a large invagination of the nurse nuclear envelope. (C) Nurse nuclei and selected meiotic nuclei of P4 ovaries are bounded by O. dioica lamin1,Citation44 whereas no odLamin1 was observed surrounding non-selected meiotic nuclei. D) Schematic representation of events in the coenocyst during P3 and P4, illustrating NPC, OC, and lamin dynamics from pre- to post-selection of meiotic nuclei. (A-C) Scale bars = 5 μm.
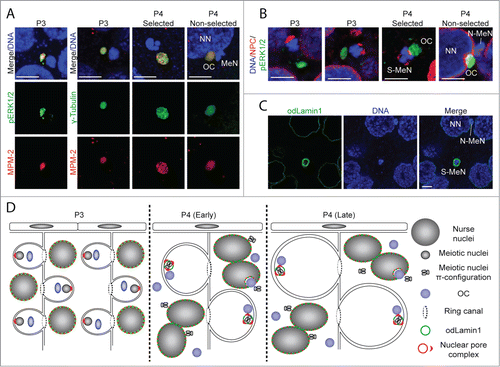
Figure 4. Localization of cell cycle kinases within the P3 and P4 coenocyst. (A) Phospho-Plk1 and phospho-Aurora localized to OCs juxtaposed to meiotic nuclei in P3. Active Aurora kinase was also present in meiotic nuclei at this stage. In P4, active Plk1 translocated only to meiotic nuclei (arrowheads) that had been selected (H3-pS28 positive; see P4 panels in (B and C) and Fig. S2A) to populate growing oocytes. It was not present on non-selected meiotic nuclei (arrows) and was no longer present on OCs. During this stage, active Aurora kinase was retained only in meiotic nuclei that had been selected to populate growing oocytes, and was no longer present on OCs or on unselected meiotic nuclei. At the P4 stage, chromatin in all meiotic nuclei had attained the more condensed π−configuration.Citation6,7,28 B) O. dioica CDK1a localized to MPM-2 stained OCs juxtaposed to meiotic nuclei in P3. In P4, odCDK1a was no longer observed at OCs. Instead, it was present on meiotic nuclei which did not retain H3-pS28 staining (arrows) and had not been selected to populate growing oocytes. (C) O. dioica CDK1d exhibited the same spatiotemporal P3 to P4 dynamics as od CDK1a. Schemas in the right column of panels summarize the results in the corresponding rows. Coloring of epitopes in the schemas corresponds to that given in the labels at the left side of each row of images. Scale bars = 5 μm.
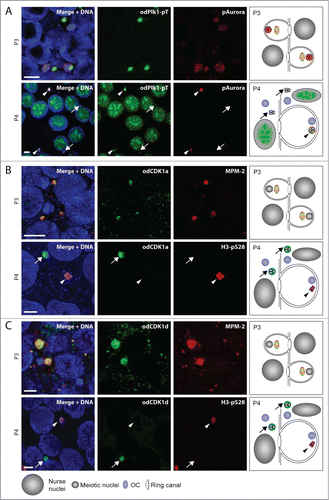
Figure 5. Summary of localizations of cell cycle regulators and markers during P3 and P4 in the O. dioica coenocyst, with respect to organizing centers (OC), meiotic nuclei in prophase I, and endocycling nurse nuclei. In P4, a proportion of the meiotic nuclei had been selected to populate growing oocytes (black bars), whereas the remaining meiotic nuclei had not been selected (red bars) and were present in the general coenocyst cytoplasm. The degree of presence of each parameter is indicated by degree of shading of the lines from light (weakly present) to dark (strongly present). M-phase MPM-2 phosphoepitopes were observed on OCs throughout P3 and P4, as was pERK. Cell cycle regulators odCDK1a,d,e, phospho-Plk1 (pPLK1) and phospho-Aurora (pAurora) were present on OCs during P3 but lost from OCs during P4. Toward the transition from P3 to P4 H3-pS28 staining increased on meiotic nuclei. This staining was retained throughout P4 on selected meiotic nuclei but was progressively lost on non-selected meiotic nuclei. At P4, odCDK1 paralogs translocated from OCs to non-selected meiotic nuclei whereas pPlk1, translocated from OCs to selected meiotic nuclei. The pAurora kinase, present on all meiotic nuclei in P3, was retained on selected nuclei in P4 but lost from non-selected meiotic nuclei. MPM-2 phosphoepitopes, absent from meiotic nuclei in P3, became progressively enriched on both selected and non-selected meiotic nuclei during P4. MPM-2 phophoepitopes also appeared as small foci within nurse nuclei during P4, as did foci of pERK, the latter consistent with observations in previous work.Citation28 Nurse nuclei also exhibited nucleolar pPlk1 staining during P4. In P3, odLamin1 surrounded both meiotic and nurse nuclei. During P4, odLamin was retained on nurse and selected meiotic nuclei but was lost from non-selected meiotic nuclei.
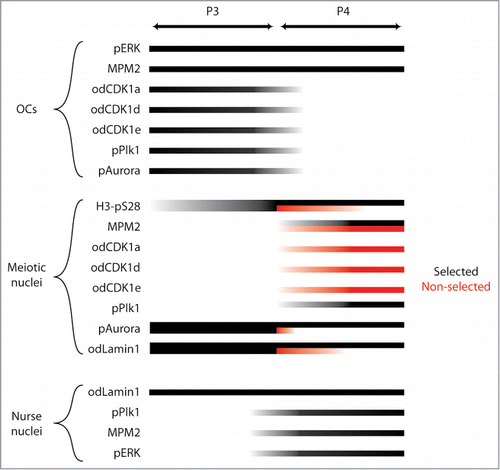
Figure 6. Phenotypes resulting from dsRNA knockdown of odCDK1a. A) Significant (**P < 0.01) knockdown of the targeted odCDK1a was verified by qRT-PCR. No significant off-target effects on other odCDK1 paralogs were detected. B) Oocytes spawned from females where ovaries had been co-injected with dsRNA (GFP-positive) against odCDK1a and capped mRNA coding for histone H2B-eGFP (selection marker for successful injection), failed to develop after exposure to sperm from wild type males. Oocytes spawned from wild-type non-injected females (Control) exposed to the same pool of wild type sperm developed normally. Oocytes derived from females whose ovaries had been co-injected as above, but failed to exhibit histone H2B-eGFP fluorescence (GFP-negative) also developed normally. The number of oocytes/embryos assessed is given across the top of the histogram bars. Legend: UF, UnFertilized; CA, early embryo Cleavage Arrest; D, Developed normally. C) Oocytes that were spawned from ovaries where odCDK1a had been knocked down were considerably smaller (***P < 0.001) compared to oocytes produced from wild-type and H2B-eGFP negative females. A similar effect in reducing spawned oocyte size was observed upon treatment of day 6 females with 200 nM calyculin A (Calyc.; **P < 0.01) or 20 μM roscovitine (Rosc.; ***P < 0.001) as compared to control females incubated in the presence of the DMSO solute alone. Scale bars = 20 μm. D) Ring canal diameters of growing oocytes were not affected by dsRNA knockdown of odCDK1a or by inhibiting PP1 phosphatase activity with 200 nM calyculin. E) Knockdown of odCDK1a did not significantly alter the proportions of selected vs. non-selected meiotic nuclei as determined by H3-pS28 staining (P = 0.19). F) Females injected with dsRNA targeting odCDK1a often released clumps of unresolved oocytes embedded in excess cytoplasm. This was never observed in wild type females, or in females injected with dsRNA targeting odCDK1d or odCDK1e.
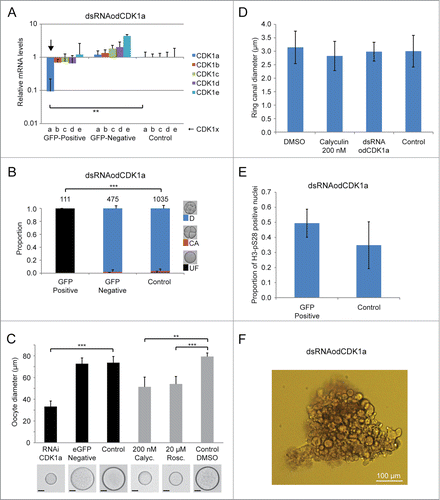
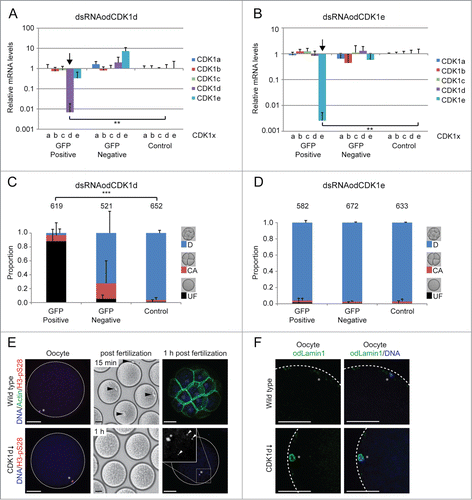
Figure 7. Phenotypes resulting from dsRNA knockdown of odCDK1d and e. (A and B) Significant (**P < 0.01) knockdown of the targeted odCDK1d (A) and odCDK1e (B) was verified by qRT-PCR. No significant off-target effects on other odCDK1 paralogs were detected in either case. (C) Oocytes spawned from females where ovaries had been co-injected with dsRNA (GFP-Positive) against odCDK1d and capped mRNA coding for histone H2B-eGFP (selection marker for successful injection), failed to develop after exposure to sperm from wild type males. Oocytes spawned from wild-type non-injected females (Control) exposed to the same pool of wild type sperm developed normally. Oocytes derived from females whose ovaries had been co-injected as above, but failed to exhibit histone H2B-eGFP fluorescence (GFP-Negative) also developed normally in most cases though there was an elevated degree of embryonic arrest following initial cleavages. The number of oocytes/embryos assessed is given across the top of the histogram bars. (D) Similar experiments generating the knockdown of odCDK1e did not affect the developmental potential of oocytes spawned from females positive for H2B-eGFP. E) The majority of oocytes that were spawned from ovaries where odCDK1d had been knocked down appeared normal, with chromatin (*) at the oocyte cortex (left panels), as in wild type oocytes. However, whereas polar body extrusion (arrowheads, upper mid-panel) was observed within 15 minutes in wild type embryos, no polar body was extrusion was observed after 1 h post fertilization in odCDK1d deficient embryos (lower mid-panel). Control embryos reached the 32-cell stage by 1 h, whereas odCDK1d deficient embryos did not develop and contained one H3-pS28 positive prophase-I arrested female nucleus and up to 4 sperm nuclei (arrowheads, right panel insert). Scale bars = 50 μm. F) Wild type oocytes were spawned in Metaphase I arrest whereas those produced from females where CDK1d had been knocked down, retained a nuclear lamin envelope, indicating that they had not resumed meiosis from prophase I arrest. Scale bars = 20 μm.