1,013
Views
8
CrossRef citations to date
0
Altmetric
Reports

The centrosomal component CEP161 of Dictyostelium discoideum interacts with the Hippo signaling pathway

, , , , &
Pages 1024-1035 | Received 13 Nov 2014, Accepted 07 Jan 2015, Published online: 01 Apr 2015

Figures & data

Figure 1 (See previous page). CEP161 as a novel centrosomal protein in D. discoideum. (A) CEP161 protein and domain structure. (B) γ-TuRC domain sequence alignment. Protein accession numbers: Dictyostelium discoideum (Dd) (DDB_G0282851), Drosophila melanogaster (Dm) centrosomin (CNN) (NP_725298.1) and Human (Hs) (NP_060719). The numbers indicate the amino acid position of the γ-TuRC domain in the respective proteins. Color code: Red background, identical residues; yellow background, similar residues. (C) Localization of CEP161 at the centrosome in AX2 cells. CEP161 was detected with mAb K83-632-4. (D) Colocalization of CEP161 and GFP-CP250 at the centrosome (upper panel). mAb K83-632-4 recognizes GFP-CEP161 at the centrosome (lower panel). (E) Colocalization of GFP-CEP161 with comitin at the Golgi complex. Comitin was detected with mAb 190-340-8. DAPI was used to stain the nucleus. Scale bar, 10 μm. (F) Overview of N-terminally GFP-tagged CEP161 proteins. (G) Expression of GFP-tagged CEP161 proteins in AX2 cells. Proteins from whole cell lysates were separated by SDS-PAGE (10% acrylamide). mAb K3-184-2 was used to detect the GFP-fusion proteins Alpha-tubulin detected with mAb YL1/2 was used as the loading control. (H) Detection of endogenous CEP161 and GFP-tagged proteins with polyclonal antibodies specific for CEP161. The proteins were resolved by SDS-PAGE (10% acrylamide). The arrow indicates the position of endogenous CEP161. (I) Quantification of the protein gel blot results for amounts of endogenous CEP161 and GFP-tagged proteins. (J) Subcellular localization of GFP-tagged proteins. DAPI was used to stain the nucleus, the centrosome in D3 cells was stained with CP250 specific mAb K68-439-8. Scale bar, 5 μm.
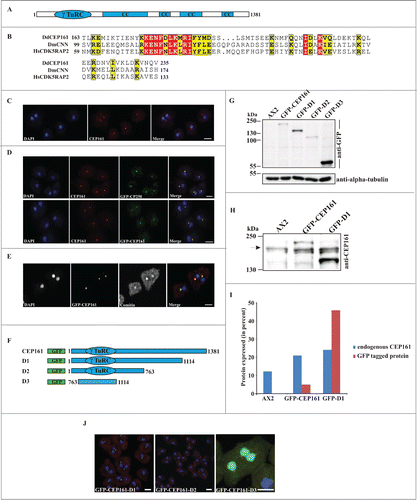
Figure 1 (See previous page). CEP161 as a novel centrosomal protein in D. discoideum. (A) CEP161 protein and domain structure. (B) γ-TuRC domain sequence alignment. Protein accession numbers: Dictyostelium discoideum (Dd) (DDB_G0282851), Drosophila melanogaster (Dm) centrosomin (CNN) (NP_725298.1) and Human (Hs) (NP_060719). The numbers indicate the amino acid position of the γ-TuRC domain in the respective proteins. Color code: Red background, identical residues; yellow background, similar residues. (C) Localization of CEP161 at the centrosome in AX2 cells. CEP161 was detected with mAb K83-632-4. (D) Colocalization of CEP161 and GFP-CP250 at the centrosome (upper panel). mAb K83-632-4 recognizes GFP-CEP161 at the centrosome (lower panel). (E) Colocalization of GFP-CEP161 with comitin at the Golgi complex. Comitin was detected with mAb 190-340-8. DAPI was used to stain the nucleus. Scale bar, 10 μm. (F) Overview of N-terminally GFP-tagged CEP161 proteins. (G) Expression of GFP-tagged CEP161 proteins in AX2 cells. Proteins from whole cell lysates were separated by SDS-PAGE (10% acrylamide). mAb K3-184-2 was used to detect the GFP-fusion proteins Alpha-tubulin detected with mAb YL1/2 was used as the loading control. (H) Detection of endogenous CEP161 and GFP-tagged proteins with polyclonal antibodies specific for CEP161. The proteins were resolved by SDS-PAGE (10% acrylamide). The arrow indicates the position of endogenous CEP161. (I) Quantification of the protein gel blot results for amounts of endogenous CEP161 and GFP-tagged proteins. (J) Subcellular localization of GFP-tagged proteins. DAPI was used to stain the nucleus, the centrosome in D3 cells was stained with CP250 specific mAb K68-439-8. Scale bar, 5 μm.

Figure 2 (See previous page). CEP161 regulates nuclear and centrosomal number and affects cell size and growth. (A) Nuclei number per cell. (B) Nucleus-centrosome distance. The percentage of cells with the indicated distances is given. (C) Nucleus-centrosome ratio. The percentage of cells is given. A total of 600 cells were counted for AX2 and mutant strains for each of the experiments in A, B, and C. (D) Confocal images for D1 and D2 cells showing increased centrosome numbers. DAPI was used to stain the nucleus. Scale bar, 5 μm. (E) Cell size of the strains in micrometers. (F) Growth on K. aerogenes. (G) Growth in axenic medium in shaking culture. (H) Phagocytosis was assayed using the strains from (G) and TRITC-labeled yeast. Approximately 200 cells from each strain were counted. The percentage of cells which had engulfed yeast particles after 15 min is shown in the graph (***P < 0.001).
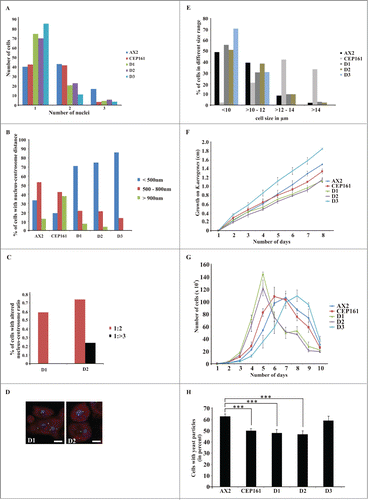
Figure 2 (See previous page). CEP161 regulates nuclear and centrosomal number and affects cell size and growth. (A) Nuclei number per cell. (B) Nucleus-centrosome distance. The percentage of cells with the indicated distances is given. (C) Nucleus-centrosome ratio. The percentage of cells is given. A total of 600 cells were counted for AX2 and mutant strains for each of the experiments in A, B, and C. (D) Confocal images for D1 and D2 cells showing increased centrosome numbers. DAPI was used to stain the nucleus. Scale bar, 5 μm. (E) Cell size of the strains in micrometers. (F) Growth on K. aerogenes. (G) Growth in axenic medium in shaking culture. (H) Phagocytosis was assayed using the strains from (G) and TRITC-labeled yeast. Approximately 200 cells from each strain were counted. The percentage of cells which had engulfed yeast particles after 15 min is shown in the graph (***P < 0.001).

Figure 3. CEP161 plays an important role in development. (A) Development of wild type and mutant cell strains on phosphate agar plates. Pictures were taken after 24 hours. Scale bar, 500 μm. (B) Stream formation on a plastic surface under phosphate buffer. The time points (in hours) indicate the occurrence of stream formation. Scale bar, 250 μm. (C) Expression of csA during starvation in shaken suspension. Cells were collected at the indicated time points and cell lysates analyzed by SDS-PAGE and western blot. csA was detected by mAb 33-294, mAb 47-16-1 detected α-actinin which was used as loading control. Since α-actinin blot was similar for all strains, only the α-actinin blot for AX2 is shown. (D) Cell-substrate adhesion. Percentage of cells detached from a plastic surface after shaking at 200 rpm for 1 hour. The symbol * indicates the significance of the p-Value. *<0.5, ***<0.001.
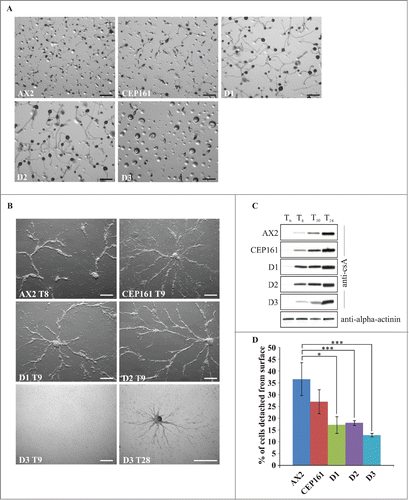
Figure 3. CEP161 plays an important role in development. (A) Development of wild type and mutant cell strains on phosphate agar plates. Pictures were taken after 24 hours. Scale bar, 500 μm. (B) Stream formation on a plastic surface under phosphate buffer. The time points (in hours) indicate the occurrence of stream formation. Scale bar, 250 μm. (C) Expression of csA during starvation in shaken suspension. Cells were collected at the indicated time points and cell lysates analyzed by SDS-PAGE and western blot. csA was detected by mAb 33-294, mAb 47-16-1 detected α-actinin which was used as loading control. Since α-actinin blot was similar for all strains, only the α-actinin blot for AX2 is shown. (D) Cell-substrate adhesion. Percentage of cells detached from a plastic surface after shaking at 200 rpm for 1 hour. The symbol * indicates the significance of the p-Value. *<0.5, ***<0.001.

Figure 4. CEP161 affects unicellular motility and multicellular migration. (A) Analysis of chemotactic cell motility of AX2 and mutants. Time-lapse image series were captured and stored on a computer hard drive at 30-second intervals. Images were taken at magnifications of 10X every 30 s. The DIAS software was used to trace individual cells along image series and calculate motility parameters. Speed refers to the speed of the cell's centroid movement along the total path; directionality indicates migration straightness; direction change refers to the number and frequency of turns; persistence is an estimation of movement in the direction of the path. Values are mean ± standard deviation of >30 cells from 3 or more independent experiments. The symbol * indicates the significance of the p-Value. *<0.5, **<0.01, ***<0.001. (B) Images showing the cell shape of aggregation competent cells of AX2, CEP161 and D3 cells. Scale bar, 50 μm. (C) Phototaxis assay. Slugs and slug trails were transferred to nitrocellulose filters and stained with amido black. The red arrow indicates the source of light. (D.) Angle of deviation of the slugs in response to light source. Slugs from four individual experiments were analyzed.
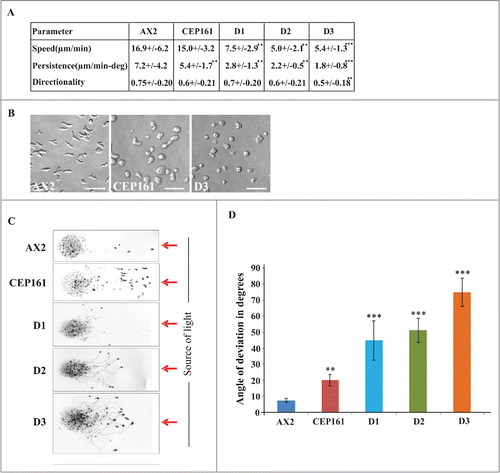
Figure 4. CEP161 affects unicellular motility and multicellular migration. (A) Analysis of chemotactic cell motility of AX2 and mutants. Time-lapse image series were captured and stored on a computer hard drive at 30-second intervals. Images were taken at magnifications of 10X every 30 s. The DIAS software was used to trace individual cells along image series and calculate motility parameters. Speed refers to the speed of the cell's centroid movement along the total path; directionality indicates migration straightness; direction change refers to the number and frequency of turns; persistence is an estimation of movement in the direction of the path. Values are mean ± standard deviation of >30 cells from 3 or more independent experiments. The symbol * indicates the significance of the p-Value. *<0.5, **<0.01, ***<0.001. (B) Images showing the cell shape of aggregation competent cells of AX2, CEP161 and D3 cells. Scale bar, 50 μm. (C) Phototaxis assay. Slugs and slug trails were transferred to nitrocellulose filters and stained with amido black. The red arrow indicates the source of light. (D.) Angle of deviation of the slugs in response to light source. Slugs from four individual experiments were analyzed.

Figure 5 (See previous page). DdCEP161 as a novel interacting partner of DdHrk-svk. (A) Sequence alignment for the Serine/Threonine protein kinase domain of Human (Hs) MST2 (NP_006272.2), Drosophila (Dm) Hippo (NP_611427.1) and Dictyostelium (Dd) Hrk-svk (DDB_G0286359). The numbers indicate the position of the amino acid sequence of the STK domain in the respective proteins. Color code: Red background, identical residues; yellow background, similar residues. (B) GST-tagged polypeptides for (i) CEP161 and (ii) Hrk-svk. (C) CEP161 interacts with Hrk-svk. Pull down assay with GST-tagged residues 1-763 and 763-1114 of CEP161. (D) Pull down assay with GST-tagged residues 290-478 and 1-323 of Hrk-svk. AX2 cell lysates were used for the pull downs in C and D. The blots were probed with the indicated antibodies. The GST-fusions were revealed by Ponceau S staining. (E) Phosphorylation assay. GST-CEP161-D2 negatively regulates the auto- and trans-phosphorylation abilities of GST-Hrk-svk-E1. MBP, myelin basic protein. (F) Immunofluorescence analysis showing the colocalization of CEP161 with GFP-tagged Hrk-svk in AX2 cells. CEP161 was detected by mAb K83-632-4, nuclei were stained with DAPI. Size bar, 5 μm.
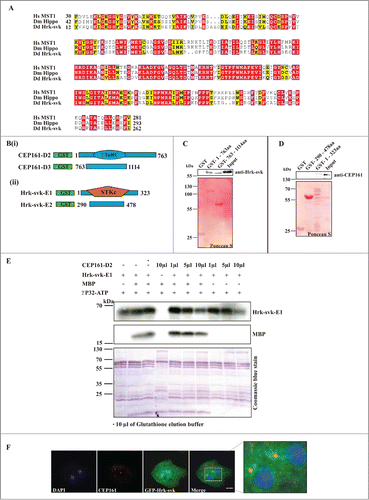
Figure 5 (See previous page). DdCEP161 as a novel interacting partner of DdHrk-svk. (A) Sequence alignment for the Serine/Threonine protein kinase domain of Human (Hs) MST2 (NP_006272.2), Drosophila (Dm) Hippo (NP_611427.1) and Dictyostelium (Dd) Hrk-svk (DDB_G0286359). The numbers indicate the position of the amino acid sequence of the STK domain in the respective proteins. Color code: Red background, identical residues; yellow background, similar residues. (B) GST-tagged polypeptides for (i) CEP161 and (ii) Hrk-svk. (C) CEP161 interacts with Hrk-svk. Pull down assay with GST-tagged residues 1-763 and 763-1114 of CEP161. (D) Pull down assay with GST-tagged residues 290-478 and 1-323 of Hrk-svk. AX2 cell lysates were used for the pull downs in C and D. The blots were probed with the indicated antibodies. The GST-fusions were revealed by Ponceau S staining. (E) Phosphorylation assay. GST-CEP161-D2 negatively regulates the auto- and trans-phosphorylation abilities of GST-Hrk-svk-E1. MBP, myelin basic protein. (F) Immunofluorescence analysis showing the colocalization of CEP161 with GFP-tagged Hrk-svk in AX2 cells. CEP161 was detected by mAb K83-632-4, nuclei were stained with DAPI. Size bar, 5 μm.

Table 1. Phenotypes of D. discoideum mutants with defects in components of the Hippo pathway

Figure 6. Model for the regulation of Hippo signaling by CEP161. In D. discoideum, CEP161 interacts with Hrk-svk and reduces its auto- and trans-phosphorylation ability presumably leading to an inhibition of the pathway. CEP161 influence on Hippo pathway components is shown in various colors, with black pointed arrows for direct interactions and red blunt lines indicating inhibitory interactions and blue arrows point to the affected functions.
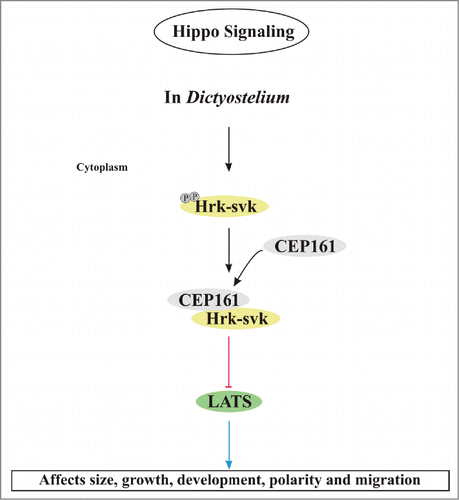
Figure 6. Model for the regulation of Hippo signaling by CEP161. In D. discoideum, CEP161 interacts with Hrk-svk and reduces its auto- and trans-phosphorylation ability presumably leading to an inhibition of the pathway. CEP161 influence on Hippo pathway components is shown in various colors, with black pointed arrows for direct interactions and red blunt lines indicating inhibitory interactions and blue arrows point to the affected functions.