1,424
Views
3
CrossRef citations to date
0
Altmetric
Reports

A delay prior to mitotic entry triggers caspase 8-dependent cell death in p53-deficient Hela and HCT-116 cells

, , &
Pages 1070-1081 | Received 11 Dec 2014, Accepted 07 Jan 2015, Published online: 01 Apr 2015

Figures & data

Figure 1. Stathmin-depleted cells only die if they are delayed in entering mitosis. Hela cells were synchronized with a double thymidine block and transfected with non-targeting siRNA (NT siRNA) or stathmin (STMN) siRNA, and released into medium containing DMSO or the Wee 1 inhibitor MK1775. (A) Western blot of stathmin knockdown, reprobed for tubulin as a loading control. Stathmin level was reduced by approximately 75% compared to non-targeting siRNA transfected cells as shown previously.Citation11–13 (B) Mitotic index was determined at 2 hour intervals for 12 hours following release from the double thymidine block. Wee1 inhibition restored mitotic entry timing in stathmin-depleted cells to that of control treated cells. (C) Viability was assayed at 48 hours after the second thymidine release via trypan blue exclusion. Relieving the mitotic entry delay in stathmin-depleted cells restored viability to that of control treated cells. ** denotes P < 0.01.
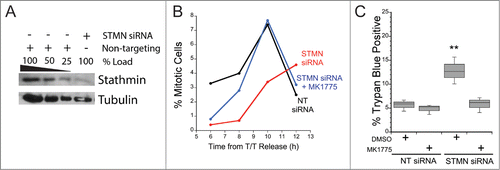
Figure 1. Stathmin-depleted cells only die if they are delayed in entering mitosis. Hela cells were synchronized with a double thymidine block and transfected with non-targeting siRNA (NT siRNA) or stathmin (STMN) siRNA, and released into medium containing DMSO or the Wee 1 inhibitor MK1775. (A) Western blot of stathmin knockdown, reprobed for tubulin as a loading control. Stathmin level was reduced by approximately 75% compared to non-targeting siRNA transfected cells as shown previously.Citation11–13 (B) Mitotic index was determined at 2 hour intervals for 12 hours following release from the double thymidine block. Wee1 inhibition restored mitotic entry timing in stathmin-depleted cells to that of control treated cells. (C) Viability was assayed at 48 hours after the second thymidine release via trypan blue exclusion. Relieving the mitotic entry delay in stathmin-depleted cells restored viability to that of control treated cells. ** denotes P < 0.01.

Figure 2. A mitotic entry delay triggers cell death in p53-deficient cells. Hela or HCT116 cells were synchronized with a double thymidine block protocol, released and pulsed with either DMSO, a combination of S1451 (300 nM; AURKA inhibitor) and BI2536 (0.8 nM; PLK1 inhibitor), or RO3306 (10 μM; CDK1 inhibitor) for 4 hours beginning 6 hours after the second release. Cell viability was measured by morphological changes recorded from phase contrast images or trypan blue exclusion. (A) Representative phase contrast images of a cell undergoing apoptosis following a mitotic entry delay. Time, in minutes, is given in each frame from an arbitrary point prior to cell retraction. Scale bar is 10 μm. (B) Cells were followed by phase contrast imaging for 48–72 hrs after the 4 hr drug inhibitor pulse and cell death measured by morphological changes as shown in (A). The mitotic entry delay induced by either a combination of 300 nM S1451 and 0.8 nM BI2536 or 10 μM RO33306 significantly increased the percentage of cells that died within 72 hours after the drug pulse. (C) Asynchronously growing Hela or HCT116 p53−/− cells were treated with a 4 hour pulse of inhibitors and followed by live cell recordings as in (A, B). Treatment with the combination of 300 nM S1451 and 0.8 nM BI2536 or with 10 μM RO33306 in asynchronously growing cell populations did not decrease cell viability, demonstrating that the drugs are not simply toxic throughout the cell cycle. (D) Synchronized HCT116 p53+/+ and p53−/− cell lines were pulsed with 10 μM RO3306 as in (B). Viability was assayed 48 hours post inhibitor treatment via trypan blue exclusion. A mitotic entry delay via CDK1 inhibition decreased cell viability only in the p53 knockout cell line. Graphs are representative of at least 3 independent experiments with >300 cells/experiment. ** denotes P < 0.01, *** denotes P < 0.001.
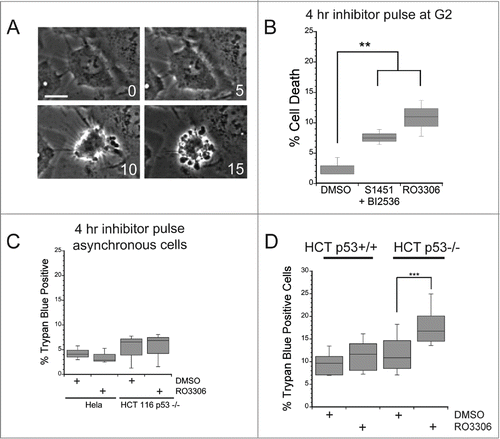
Figure 2. A mitotic entry delay triggers cell death in p53-deficient cells. Hela or HCT116 cells were synchronized with a double thymidine block protocol, released and pulsed with either DMSO, a combination of S1451 (300 nM; AURKA inhibitor) and BI2536 (0.8 nM; PLK1 inhibitor), or RO3306 (10 μM; CDK1 inhibitor) for 4 hours beginning 6 hours after the second release. Cell viability was measured by morphological changes recorded from phase contrast images or trypan blue exclusion. (A) Representative phase contrast images of a cell undergoing apoptosis following a mitotic entry delay. Time, in minutes, is given in each frame from an arbitrary point prior to cell retraction. Scale bar is 10 μm. (B) Cells were followed by phase contrast imaging for 48–72 hrs after the 4 hr drug inhibitor pulse and cell death measured by morphological changes as shown in (A). The mitotic entry delay induced by either a combination of 300 nM S1451 and 0.8 nM BI2536 or 10 μM RO33306 significantly increased the percentage of cells that died within 72 hours after the drug pulse. (C) Asynchronously growing Hela or HCT116 p53−/− cells were treated with a 4 hour pulse of inhibitors and followed by live cell recordings as in (A, B). Treatment with the combination of 300 nM S1451 and 0.8 nM BI2536 or with 10 μM RO33306 in asynchronously growing cell populations did not decrease cell viability, demonstrating that the drugs are not simply toxic throughout the cell cycle. (D) Synchronized HCT116 p53+/+ and p53−/− cell lines were pulsed with 10 μM RO3306 as in (B). Viability was assayed 48 hours post inhibitor treatment via trypan blue exclusion. A mitotic entry delay via CDK1 inhibition decreased cell viability only in the p53 knockout cell line. Graphs are representative of at least 3 independent experiments with >300 cells/experiment. ** denotes P < 0.01, *** denotes P < 0.001.

Figure 3. Cell death occurs asynchronously and over several days for cells depleted of stathmin or pulsed with AURKA and PLK1 inhibitors to delay mitotic entry. Time is plotted from the completion of the last mitosis to the initiation of cell death as detected by morphological changes observed from long term live cell recordings. Data shown are for Hela cells treated with (A) stathmin depletion or (B) synchronized and pulsed with a combination of 300 nM S1451 and 0.8 nM BI2536. Each horizontal bar represents an individual cell. Cells dying at a time of zero reflect cells that died during mitosis.
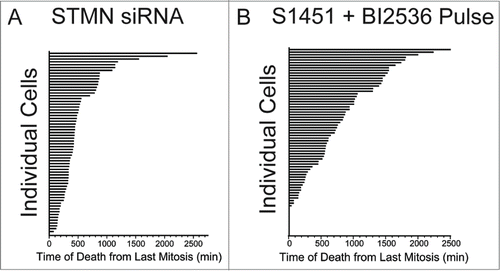
Figure 3. Cell death occurs asynchronously and over several days for cells depleted of stathmin or pulsed with AURKA and PLK1 inhibitors to delay mitotic entry. Time is plotted from the completion of the last mitosis to the initiation of cell death as detected by morphological changes observed from long term live cell recordings. Data shown are for Hela cells treated with (A) stathmin depletion or (B) synchronized and pulsed with a combination of 300 nM S1451 and 0.8 nM BI2536. Each horizontal bar represents an individual cell. Cells dying at a time of zero reflect cells that died during mitosis.

Figure 4. Neither stathmin depletion nor a delay at mitotic entry result in significant mitotic errors. (A) Mitotic duration times for Hela cells treated as indicated. Times were measured from live cell recordings. As a positive control for delayed mitotic progression, cells were incubated in 1 μM RO3306, a concentration of the CDK1 inhibitor sufficient to allow mitotic entry 25 but shown to produce defects in spindle assembly. Stathmin depletion did not lengthen mitotic duration, consistent with our previous results.Citation12 A 4 hr pulse with a combination of 300 nM S1451 and 0.8 nM BI2536 also did not slow mitosis, but a pulse with 10 μM RO3306 lengthened mitosis by an average of 13 min. Data represent 120–450 mitotic cells per condition from at least 3 experiments. (B, C) Hela cells were fixed and stained to label tubulin (green) and DNA (red). (B) Spindle morphologies were scored for each experimental condition as indicated. None of the experimental conditions used to delay mitotic entry produced significant defects in spindle assembly. In contrast, 24 incubation in 1–3 μM RO3306 produced dramatic changes to spindle shape and chromosome orientations, consistent with McCloy et al (see ref 25). 50–100 mitotics were scored for each condition in each of 3 experiments. (C) Interphase cells were scored for the number of nuclei per cell to assay for errors in completing mitosis/cytokinesis. Neither stathmin depletion nor a 4 hr pulse with 10 μM RO3306 increased the percentage of Hela cells with >1 nucleus. In contrast, 24 hr incubation in 3 μM RO3306 significantly increased the percent multinucleate cells. Approximately 200 cells were scored per condition in each of 3 experiments. (D) Hela cells were depleted of stathmin and treated for 4 hrs with cytochalasin B beginning 44 or 68 hr after transfection, fixed and stained for tubulin and DNA. The number of micronuclei were scored for each binucleate cell, where the binucleate cells reflect those cells that were prevented from completing cytokinesis during the 4 hr drug treatment. Micronuclei reflect defects in segregation that result in 1 or more chromosomes failing to segregate with the rest of the chromosomes.Citation26 Data shown are from 2 experiments with fixation 72 hr after transfection. Results shown are from ∼350 cells per treatment group from 3 independent experiments. Identical results were obtained for cells fixed at 48 hr after transfection. (E) Live cell recordings as in (A) were also used to measure the percent of cells showing aberrant divisions (defined as cells dividing into > 2 daughter cells or in daughter cells containing > 1 nucleus at the completion of cytokinesis).
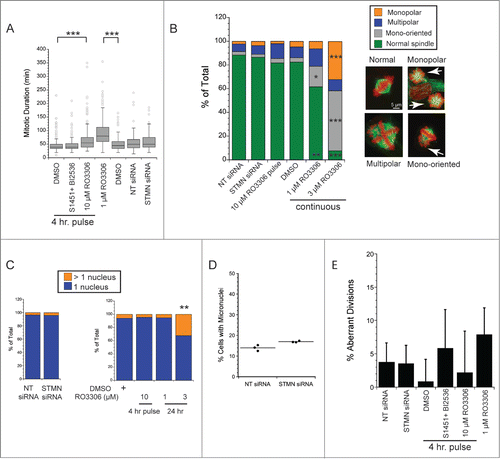
Figure 4. Neither stathmin depletion nor a delay at mitotic entry result in significant mitotic errors. (A) Mitotic duration times for Hela cells treated as indicated. Times were measured from live cell recordings. As a positive control for delayed mitotic progression, cells were incubated in 1 μM RO3306, a concentration of the CDK1 inhibitor sufficient to allow mitotic entry 25 but shown to produce defects in spindle assembly. Stathmin depletion did not lengthen mitotic duration, consistent with our previous results.Citation12 A 4 hr pulse with a combination of 300 nM S1451 and 0.8 nM BI2536 also did not slow mitosis, but a pulse with 10 μM RO3306 lengthened mitosis by an average of 13 min. Data represent 120–450 mitotic cells per condition from at least 3 experiments. (B, C) Hela cells were fixed and stained to label tubulin (green) and DNA (red). (B) Spindle morphologies were scored for each experimental condition as indicated. None of the experimental conditions used to delay mitotic entry produced significant defects in spindle assembly. In contrast, 24 incubation in 1–3 μM RO3306 produced dramatic changes to spindle shape and chromosome orientations, consistent with McCloy et al (see ref 25). 50–100 mitotics were scored for each condition in each of 3 experiments. (C) Interphase cells were scored for the number of nuclei per cell to assay for errors in completing mitosis/cytokinesis. Neither stathmin depletion nor a 4 hr pulse with 10 μM RO3306 increased the percentage of Hela cells with >1 nucleus. In contrast, 24 hr incubation in 3 μM RO3306 significantly increased the percent multinucleate cells. Approximately 200 cells were scored per condition in each of 3 experiments. (D) Hela cells were depleted of stathmin and treated for 4 hrs with cytochalasin B beginning 44 or 68 hr after transfection, fixed and stained for tubulin and DNA. The number of micronuclei were scored for each binucleate cell, where the binucleate cells reflect those cells that were prevented from completing cytokinesis during the 4 hr drug treatment. Micronuclei reflect defects in segregation that result in 1 or more chromosomes failing to segregate with the rest of the chromosomes.Citation26 Data shown are from 2 experiments with fixation 72 hr after transfection. Results shown are from ∼350 cells per treatment group from 3 independent experiments. Identical results were obtained for cells fixed at 48 hr after transfection. (E) Live cell recordings as in (A) were also used to measure the percent of cells showing aberrant divisions (defined as cells dividing into > 2 daughter cells or in daughter cells containing > 1 nucleus at the completion of cytokinesis).

Figure 5. ATM is not activated by stathmin depletion. Hela cell lysates were probed with antibodies to phosphorylated ATM (S1981P) to determine whether stathmin depletion induces a DNA damage response. Phosphorylated ATM was readily apparent in doxorubin treated cells, used here as a positive control. In contrast, stathmin depletion did not lead to detectable ATM activation and did not change total ATM concentration.
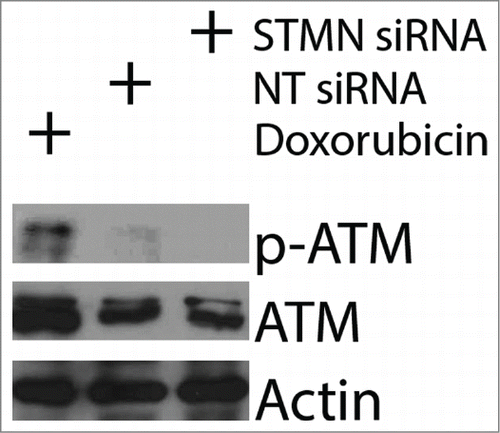
Figure 5. ATM is not activated by stathmin depletion. Hela cell lysates were probed with antibodies to phosphorylated ATM (S1981P) to determine whether stathmin depletion induces a DNA damage response. Phosphorylated ATM was readily apparent in doxorubin treated cells, used here as a positive control. In contrast, stathmin depletion did not lead to detectable ATM activation and did not change total ATM concentration.

Figure 6. Reducing p21 is not sufficient to activate apoptosis in p53 deficient cells depleted of stathmin or pulsed for 4 hrs with a CDK1 inhibitor. (A) Western blot of p21 depletion from Hela cells. Tubulin is shown as a loading control. (B) Percent trypan blue positive cells for the indicated conditions measured 48 hr after transfection of inhibitor pulse.
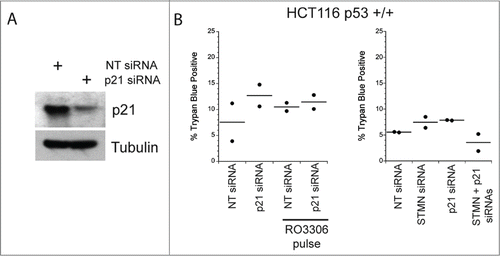
Figure 6. Reducing p21 is not sufficient to activate apoptosis in p53 deficient cells depleted of stathmin or pulsed for 4 hrs with a CDK1 inhibitor. (A) Western blot of p21 depletion from Hela cells. Tubulin is shown as a loading control. (B) Percent trypan blue positive cells for the indicated conditions measured 48 hr after transfection of inhibitor pulse.

Figure 7. Initiator caspase 9 is not required for cell death in stathmin-deleted Hela cells. (A) Western blot demonstrating knockdown of caspase 9 alone or in combination with stathmin depletion. Tubulin was used as a loading control. (B) Percent trypan blue positive cells for the indicated conditions measured 48 hr after transfection. * denotes P < 0.05.
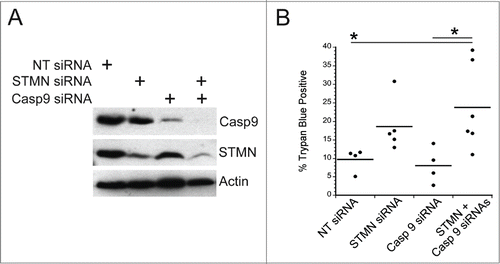
Figure 7. Initiator caspase 9 is not required for cell death in stathmin-deleted Hela cells. (A) Western blot demonstrating knockdown of caspase 9 alone or in combination with stathmin depletion. Tubulin was used as a loading control. (B) Percent trypan blue positive cells for the indicated conditions measured 48 hr after transfection. * denotes P < 0.05.

Figure 8. A mitotic entry delay triggers caspase 8 activation. (A) Western blot for cleaved caspase 8, reprobed for tubulin as a loading control for the cell lines treated as indicated. RO3306 pulsed cells were synchronized and incubated in 10 μM RO3306 for 4 hrs to delay mitotic entry. Lysates were prepared 48 hours after transfection or inhibitor pulse. Stathmin depletion or a pulse of CDK1 inhibitor to lengthen G2 increased the level of cleaved caspase 8. (B) Hela cells or HCT116 p53−/− cells were synchronized with a double thymidine block and pulsed with 10 μM RO3306 (CDK1 inhibitor) for 4 hours. Following RO3306 washout, cells were incubated with medium containing DMSO or IETD-CHO (20 μM) for 48 hours and assayed for viability via trypan blue exclusion. Caspase 8 inhibition with IETD-CHO restored viability in RO3306 treated cells. (C) Western blot demonstrating knockdown of caspase 8 alone or in combination with stathmin depletion. Tubulin was used as a loading control. (D) Percent trypan blue positive cells for the indicated conditions. All graphs are representative of at least 3 independent experiments. * denotes P < 0.05, ** denotes P < 0.01, *** denotes P < 0.001.
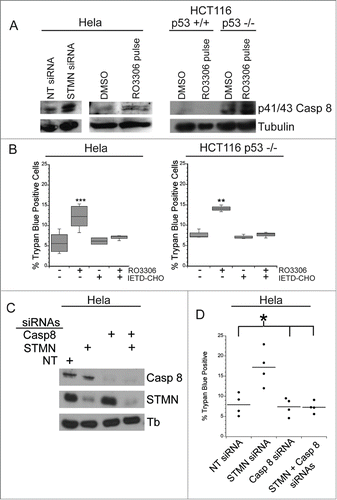
Figure 8. A mitotic entry delay triggers caspase 8 activation. (A) Western blot for cleaved caspase 8, reprobed for tubulin as a loading control for the cell lines treated as indicated. RO3306 pulsed cells were synchronized and incubated in 10 μM RO3306 for 4 hrs to delay mitotic entry. Lysates were prepared 48 hours after transfection or inhibitor pulse. Stathmin depletion or a pulse of CDK1 inhibitor to lengthen G2 increased the level of cleaved caspase 8. (B) Hela cells or HCT116 p53−/− cells were synchronized with a double thymidine block and pulsed with 10 μM RO3306 (CDK1 inhibitor) for 4 hours. Following RO3306 washout, cells were incubated with medium containing DMSO or IETD-CHO (20 μM) for 48 hours and assayed for viability via trypan blue exclusion. Caspase 8 inhibition with IETD-CHO restored viability in RO3306 treated cells. (C) Western blot demonstrating knockdown of caspase 8 alone or in combination with stathmin depletion. Tubulin was used as a loading control. (D) Percent trypan blue positive cells for the indicated conditions. All graphs are representative of at least 3 independent experiments. * denotes P < 0.05, ** denotes P < 0.01, *** denotes P < 0.001.

Figure 9. Both p53 deficiency and stathmin depletion reduce cFLIP protein level in Hela cells. (A) HPV E6 depletion from Hela cells restored p53, consistent with our previous results.Citation11,12 Lysates were prepared from Hela cells either untransfected or transfected with siRNA targeting HPV protein E6 and treated with Doxorubicin (included to stabilize p53 and facilitate detection by protein gel blot) for the last 6 hours of a 48 hour incubation post transfection. Doxorubicin was only used in western blot experiments for p53 detection. (B) Hela cells (p53-deficient) have decreased cFLIPL protein levels compared to cells transfected with E6 to restore endogenous p53. Stathmin depletion also reduced the cFLIPL level relative to control siRNA-transfected cells. Western blot for cFLIPL, reprobed with GAPDH as a loading control. (C) Western blots of lysates from Hela cells transfected with FLAG-tagged cFLIP demonstrating FLAG- cFLIPL expression for the conditions indicated. Actin was used as a loading control. (D) Exogenous cFLIPL expression restored viability of stathmin-depleted cells to that of control cells. Hela cells were transfected with non-targeting siRNA or siRNA to stathmin and a plasmid containing FLAG-tagged cFLIPL or empty vector, as noted on the plot. Viability was assayed by trypan blue exclusion at 48 hours following transfection. Graph is a summary of 3 experiments. * denotes P < 0.05.
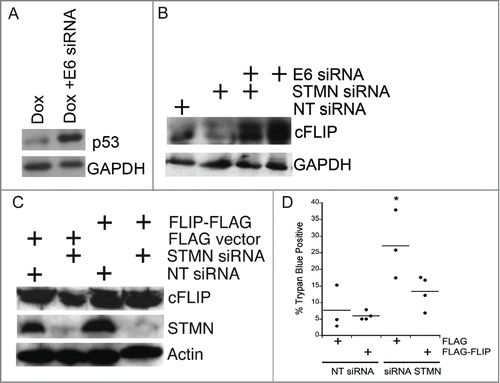
Figure 9. Both p53 deficiency and stathmin depletion reduce cFLIP protein level in Hela cells. (A) HPV E6 depletion from Hela cells restored p53, consistent with our previous results.Citation11,12 Lysates were prepared from Hela cells either untransfected or transfected with siRNA targeting HPV protein E6 and treated with Doxorubicin (included to stabilize p53 and facilitate detection by protein gel blot) for the last 6 hours of a 48 hour incubation post transfection. Doxorubicin was only used in western blot experiments for p53 detection. (B) Hela cells (p53-deficient) have decreased cFLIPL protein levels compared to cells transfected with E6 to restore endogenous p53. Stathmin depletion also reduced the cFLIPL level relative to control siRNA-transfected cells. Western blot for cFLIPL, reprobed with GAPDH as a loading control. (C) Western blots of lysates from Hela cells transfected with FLAG-tagged cFLIP demonstrating FLAG- cFLIPL expression for the conditions indicated. Actin was used as a loading control. (D) Exogenous cFLIPL expression restored viability of stathmin-depleted cells to that of control cells. Hela cells were transfected with non-targeting siRNA or siRNA to stathmin and a plasmid containing FLAG-tagged cFLIPL or empty vector, as noted on the plot. Viability was assayed by trypan blue exclusion at 48 hours following transfection. Graph is a summary of 3 experiments. * denotes P < 0.05.