1,121
Views
4
CrossRef citations to date
0
Altmetric
Report

FLJ25439, a novel cytokinesis-associated protein, induces tetraploidization and maintains chromosomal stability via enhancing expression of endoplasmic reticulum stress chaperones

, , , , , , & show all
Pages 1174-1187 | Received 22 Nov 2014, Accepted 19 Jan 2015, Published online: 18 Apr 2015

Figures & data

Figure 1. Molecular characterization of FLJ25439 protein. (A) Schematic representation of FLJ25439 domain structure. FLJ25439 protein is 361 amino acids in length. Three domains were recognized based on their sequence structure. (B) Deduced amino acid sequence of FLJ25439 protein. The tetratricopepetide repeat (TPR) is highlighted in yellow, 3 destruction boxes (D-box) are highlighted in gray and the putative nuclear export signal is underlined. The peptide used for generating 2A4 monospecific antibody against FLJ25439 is underlined in red.
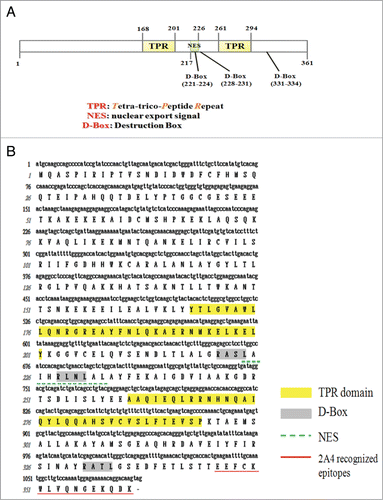
Figure 1. Molecular characterization of FLJ25439 protein. (A) Schematic representation of FLJ25439 domain structure. FLJ25439 protein is 361 amino acids in length. Three domains were recognized based on their sequence structure. (B) Deduced amino acid sequence of FLJ25439 protein. The tetratricopepetide repeat (TPR) is highlighted in yellow, 3 destruction boxes (D-box) are highlighted in gray and the putative nuclear export signal is underlined. The peptide used for generating 2A4 monospecific antibody against FLJ25439 is underlined in red.

Figure 2. Expression profile and subcellular localization of FLJ25439 protein. (A) Western blot demonstrating cell type-variation in expression pattern of FLJ25439 protein. FLJ25439 protein was recognized as a 41 kDa protein by 2A4 antibody protein gel blot. Among cell lines tested, U2OS cells express enough FLJ25439 protein to be readily detected while other cells express little or no endogenous FLJ25439. (B) Immunofluorescent micrographs of FLJ25439 protein localization during cell cycle progression. U2OS cells were fixed and immunostained with antibodies to FLJ25439 (red), ß-tubulin (green) and nuclei were counter stained with DAPI. FLJ25439 is observed at split centrosomes (arrowheads in A, E, I, M) in prophase, localized with the mitotic spindle during mitosis, distributed in the central spindle (stars in C, K, O) in anaphase and targeted to the midbody (arrows in D, L, P) in cytokinesis. The insets are an enlarged version of the region indicated by the arrows. Bar, 5 μm.
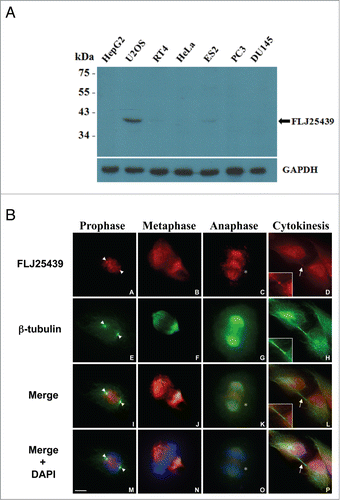
Figure 2. Expression profile and subcellular localization of FLJ25439 protein. (A) Western blot demonstrating cell type-variation in expression pattern of FLJ25439 protein. FLJ25439 protein was recognized as a 41 kDa protein by 2A4 antibody protein gel blot. Among cell lines tested, U2OS cells express enough FLJ25439 protein to be readily detected while other cells express little or no endogenous FLJ25439. (B) Immunofluorescent micrographs of FLJ25439 protein localization during cell cycle progression. U2OS cells were fixed and immunostained with antibodies to FLJ25439 (red), ß-tubulin (green) and nuclei were counter stained with DAPI. FLJ25439 is observed at split centrosomes (arrowheads in A, E, I, M) in prophase, localized with the mitotic spindle during mitosis, distributed in the central spindle (stars in C, K, O) in anaphase and targeted to the midbody (arrows in D, L, P) in cytokinesis. The insets are an enlarged version of the region indicated by the arrows. Bar, 5 μm.

Figure 3. FLJ25439 overexpression induces midbody arrest and retards mitosis during cell cycle progression. (A) Western blot identification of stable HeLa clones expressing exogenous HA-FLJ25439 fusion protein. HeLa cells were transfected for stable expression of HA-Flag-FLJ25439 protein, and stably expressing HA-tagged FLJ25439 protein was selected based on immunoblotting of cell lysate with anti-HA or 2A4 antibodies. Among cell lines tested HeLa(1-16) expresses relatively higher level of exogenous FLJ25439 protein. (B) Representative image of HeLa cells transfected with EGFP-FLJ25439 fusion protein (upper panel) and percentage of cells with midbody was scored (lower panel). Note that a large amount of cells transfected with EGFP-FLJ25439 display cytokinetic defect with prominent midbody (white arrows in D, F) decorated with EGFP compared to EGFP vector only-transfected cells. Data are mean ± S.D (n = 4, 100 cells each). **, P < 0.05. Bar, 5 μm. (C) Sequential images of HeLa (upper panel) and HeLa(1-16) (lower panel) synchronized by release from double thymidine block were captured by time lapse microscope. Arrows indicate cells undergoing mitosis. Red arrows track HeLa (1-16) that show increased time in mitosis compared to its normal counterparts (yellow arrows in HeLa or orange arrows in HeLa(1-16)). (D) Quantitative analysis of cell cycle phase of HeLa (1-16) vs HeLa wild type as a function of time (minutes). Pro-M, prometaphase; M, metaphase; A, anaphase; T, telophase. Data are mean ± S.D (n = 11). (E) HeLa(1-16) is less sensitive (IC50 = 647 μM) to oxidative stress than HeLa (IC50 = 106 μM). Cell viability was assayed by MTT assay. Data are mean ± SD (n = 3).
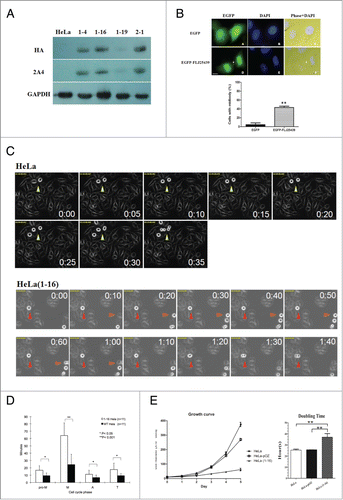
Figure 3. FLJ25439 overexpression induces midbody arrest and retards mitosis during cell cycle progression. (A) Western blot identification of stable HeLa clones expressing exogenous HA-FLJ25439 fusion protein. HeLa cells were transfected for stable expression of HA-Flag-FLJ25439 protein, and stably expressing HA-tagged FLJ25439 protein was selected based on immunoblotting of cell lysate with anti-HA or 2A4 antibodies. Among cell lines tested HeLa(1-16) expresses relatively higher level of exogenous FLJ25439 protein. (B) Representative image of HeLa cells transfected with EGFP-FLJ25439 fusion protein (upper panel) and percentage of cells with midbody was scored (lower panel). Note that a large amount of cells transfected with EGFP-FLJ25439 display cytokinetic defect with prominent midbody (white arrows in D, F) decorated with EGFP compared to EGFP vector only-transfected cells. Data are mean ± S.D (n = 4, 100 cells each). **, P < 0.05. Bar, 5 μm. (C) Sequential images of HeLa (upper panel) and HeLa(1-16) (lower panel) synchronized by release from double thymidine block were captured by time lapse microscope. Arrows indicate cells undergoing mitosis. Red arrows track HeLa (1-16) that show increased time in mitosis compared to its normal counterparts (yellow arrows in HeLa or orange arrows in HeLa(1-16)). (D) Quantitative analysis of cell cycle phase of HeLa (1-16) vs HeLa wild type as a function of time (minutes). Pro-M, prometaphase; M, metaphase; A, anaphase; T, telophase. Data are mean ± S.D (n = 11). (E) HeLa(1-16) is less sensitive (IC50 = 647 μM) to oxidative stress than HeLa (IC50 = 106 μM). Cell viability was assayed by MTT assay. Data are mean ± SD (n = 3).

Figure 4. FLJ25439 overexpression elicits tetraploidization and aberrant mitoses. (A) Representative flow cytomerty analysis of DNA content of HeLa compared to HeLa(1-16). The DNA histogram showed HeLa(1-16) harbored tetraploid DNA complement, while the parental HeLa cells are diploid. Both the nucleus (stained blue by DAPI) and cell (stained red by WGA) size of HeLa(1-16) cells are larger than those of the parental HeLa. (B) HeLa(1-16) display multipolar mitosis during cell cycle progression. Cells were synchronized by release from thymidine block and immunostained (left panel) with β-tubulin (green), γ-tubulin (red) and counter stained with DAPI (blue). Bipolar or multipolar mitoses were scored for HeLa(1-16) compared to HeLa (right panel). Data are mean ± SD (n = 3, each 100 cells). Arrows indicate centrosomes. Bar, 5 μm. ***, P < 0.01.
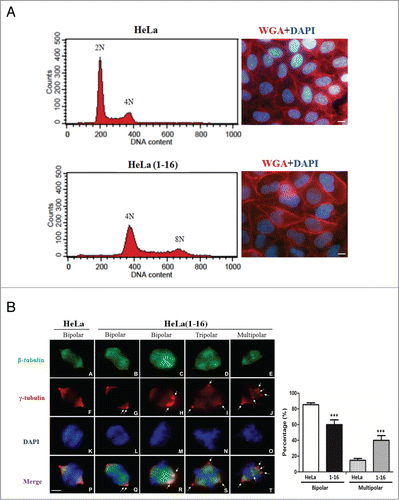
Figure 4. FLJ25439 overexpression elicits tetraploidization and aberrant mitoses. (A) Representative flow cytomerty analysis of DNA content of HeLa compared to HeLa(1-16). The DNA histogram showed HeLa(1-16) harbored tetraploid DNA complement, while the parental HeLa cells are diploid. Both the nucleus (stained blue by DAPI) and cell (stained red by WGA) size of HeLa(1-16) cells are larger than those of the parental HeLa. (B) HeLa(1-16) display multipolar mitosis during cell cycle progression. Cells were synchronized by release from thymidine block and immunostained (left panel) with β-tubulin (green), γ-tubulin (red) and counter stained with DAPI (blue). Bipolar or multipolar mitoses were scored for HeLa(1-16) compared to HeLa (right panel). Data are mean ± SD (n = 3, each 100 cells). Arrows indicate centrosomes. Bar, 5 μm. ***, P < 0.01.

Table 1. List of significantly different protein spots between mock and FLJ35439 transfected HeLa cells

Figure 5. Expression profiling and network analysis of HeLa(1-16) with FLJ25439 overexpression. (A) Comparison of 2-DE protein profiles of samples from HeLa and HeLa (1-16) groups. The protein spots found to be significantly different in volume are indicated by Arabic numbers. (B) Protein expression levels of proteins with significant changes in volume were validated by western blotting analysis. β-actin was used as an internal control and the relative expression to β-actin is shown at the bottom. (C) Top-ranked GO processes from GeneGoMetaCore pathway analysis. Pathways were ranked according to P values; bars represent the inverse log of the P value.
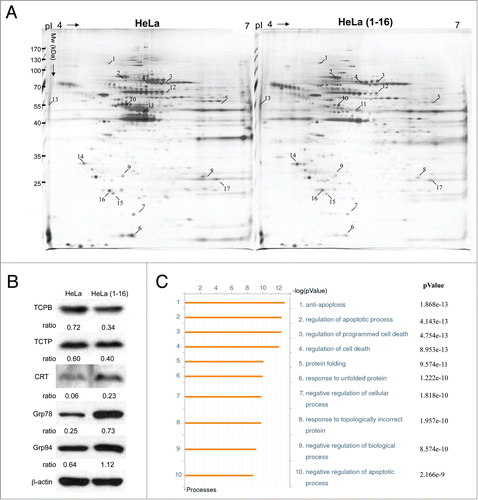
Figure 5. Expression profiling and network analysis of HeLa(1-16) with FLJ25439 overexpression. (A) Comparison of 2-DE protein profiles of samples from HeLa and HeLa (1-16) groups. The protein spots found to be significantly different in volume are indicated by Arabic numbers. (B) Protein expression levels of proteins with significant changes in volume were validated by western blotting analysis. β-actin was used as an internal control and the relative expression to β-actin is shown at the bottom. (C) Top-ranked GO processes from GeneGoMetaCore pathway analysis. Pathways were ranked according to P values; bars represent the inverse log of the P value.

Figure 6. FLJ25439 overexpression renders HeLa(1-16) resistant to oxidative stress. (A) The protein levels of Bcl-2 and Bax were determined by protein gel blotting assays. Density ratio of Bcl2 over Bax was measured by a densitometer. (B) HeLa(1-16) is less sensitive (IC50= 647 μM) to oxidative stress than HeLa (IC50 = 106 μM). Cell viability was assayed by MTT assay. Data are mean ± SD (n = 3). (C) Cell images and flow cytometric analysis for HeLa and HeLa(1-16) under hydrogen peroxide exposure. M1 represents percentage of apoptotic cells.
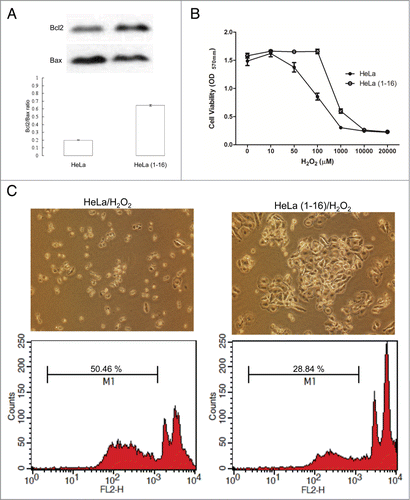
Figure 6. FLJ25439 overexpression renders HeLa(1-16) resistant to oxidative stress. (A) The protein levels of Bcl-2 and Bax were determined by protein gel blotting assays. Density ratio of Bcl2 over Bax was measured by a densitometer. (B) HeLa(1-16) is less sensitive (IC50= 647 μM) to oxidative stress than HeLa (IC50 = 106 μM). Cell viability was assayed by MTT assay. Data are mean ± SD (n = 3). (C) Cell images and flow cytometric analysis for HeLa and HeLa(1-16) under hydrogen peroxide exposure. M1 represents percentage of apoptotic cells.
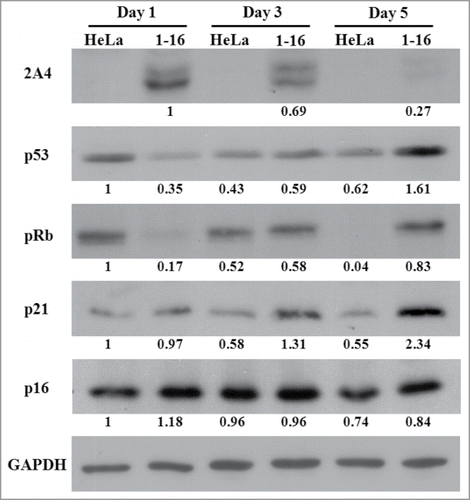
Figure 7. Western blot demonstrating elevated expression of p53, pRb and p21 in HeLa(1-16) compared to HeLa. Cell lysate was collected after different numbers of days in culture and data were quantified after GAPDH normalization. Numbers below each lane represent relative expression ratio.

Figure 7. Western blot demonstrating elevated expression of p53, pRb and p21 in HeLa(1-16) compared to HeLa. Cell lysate was collected after different numbers of days in culture and data were quantified after GAPDH normalization. Numbers below each lane represent relative expression ratio.
Supplemental material

1010906_Supplementary_Materials.zip

Download Zip (12.8 MB)

Reprints and Corporate Permissions

Please note: Selecting permissions does not provide access to the full text of the article, please see our help page How do I view content?

To request a reprint or corporate permissions for this article, please click on the relevant link below:

Academic Permissions

Please note: Selecting permissions does not provide access to the full text of the article, please see our help page How do I view content?

Obtain permissions instantly via Rightslink by clicking on the button below:

If you are unable to obtain permissions via Rightslink, please complete and submit this Permissions form. For more information, please visit our Permissions help page.