1,727
Views
10
CrossRef citations to date
0
Altmetric
Report

Impaired light detection of the circadian clock in a zebrafish melanoma model

, &
Pages 1232-1241 | Received 01 Dec 2014, Accepted 27 Jan 2015, Published online: 18 Apr 2015

Figures & data

Figure 1. Clock gene expression is downregulated in zebrafish melanoma tumors. (A) qPCR analysis of core clock genes per1, clock1, and bmal1a in tumors and skin from animals maintained on a LD cycle, then transferred to DD. Relative expression to the reference gene represents the mean ± SEM of a minimum of 5 samples per time point. White and gray backgrounds represent light and dark phases respectively. (B) Quantification of the reduction in amplitude in tumors using skin as a reference. Data represent the mean ± SEM of 5 samples. (C) Bioluminescent traces of per3-luciferase tumors and skin in LD, then transferred to DD. Results are presented as detrended data from representative samples and white and black bars under the traces represent light and dark phases respectively. (D) Period lengths in LD and DD, calculated from the bioluminescent data, are presented in hours. (E) Amplitude differences between skin and tumors in LD and DD from the bioluminescent data are presented in counts per second (CPS). Data represent the mean ± SEM of 12 samples using a Student's t-test (unpaired, 2-tailed; ***P < 0.001).
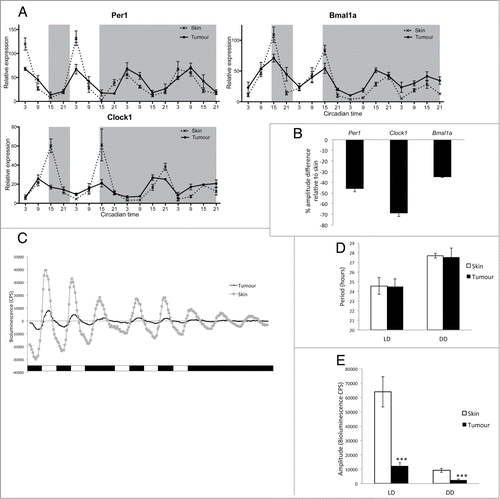
Figure 1. Clock gene expression is downregulated in zebrafish melanoma tumors. (A) qPCR analysis of core clock genes per1, clock1, and bmal1a in tumors and skin from animals maintained on a LD cycle, then transferred to DD. Relative expression to the reference gene represents the mean ± SEM of a minimum of 5 samples per time point. White and gray backgrounds represent light and dark phases respectively. (B) Quantification of the reduction in amplitude in tumors using skin as a reference. Data represent the mean ± SEM of 5 samples. (C) Bioluminescent traces of per3-luciferase tumors and skin in LD, then transferred to DD. Results are presented as detrended data from representative samples and white and black bars under the traces represent light and dark phases respectively. (D) Period lengths in LD and DD, calculated from the bioluminescent data, are presented in hours. (E) Amplitude differences between skin and tumors in LD and DD from the bioluminescent data are presented in counts per second (CPS). Data represent the mean ± SEM of 12 samples using a Student's t-test (unpaired, 2-tailed; ***P < 0.001).

Figure 2. Impaired light detection and DNA-damage repair system. (A) qPCR analysis of light inducible clock genes per2 and cry1a and light dependent DNA-damage repair genes 6,4ph (6,4 photolyase) and ddb2 (DNA damage binding protein 2). Relative expression to the reference gene represents the mean ± SEM of minimum 5 samples per time point. (B) qPCR analysis cry1a, per2, ddb2 and 6,4ph expression in skin and tumor after a 3 hour light pulse given at CT16 compared to samples kept in the dark (DD). Data represent the mean ± SEM of a minimum of 5 samples per time point. (C) Absolute fold induction of each gene in response to light in skin and tumor. Fold induction was compared between skin and tumor using a Student's t-test (unpaired, 2 tailed; **P < 0.01; ***P < 0.001). Data represent the mean ± SEM of 8 samples.
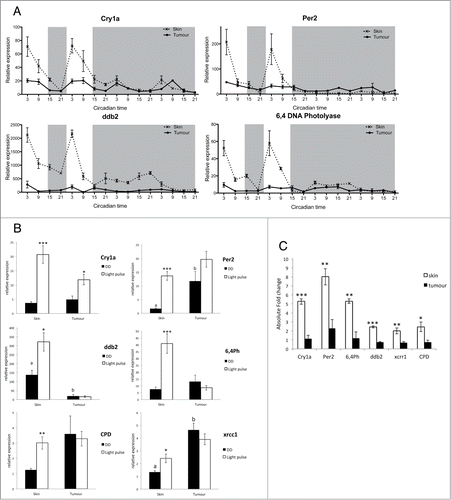
Figure 2. Impaired light detection and DNA-damage repair system. (A) qPCR analysis of light inducible clock genes per2 and cry1a and light dependent DNA-damage repair genes 6,4ph (6,4 photolyase) and ddb2 (DNA damage binding protein 2). Relative expression to the reference gene represents the mean ± SEM of minimum 5 samples per time point. (B) qPCR analysis cry1a, per2, ddb2 and 6,4ph expression in skin and tumor after a 3 hour light pulse given at CT16 compared to samples kept in the dark (DD). Data represent the mean ± SEM of a minimum of 5 samples per time point. (C) Absolute fold induction of each gene in response to light in skin and tumor. Fold induction was compared between skin and tumor using a Student's t-test (unpaired, 2 tailed; **P < 0.01; ***P < 0.001). Data represent the mean ± SEM of 8 samples.

Figure 3. Disruption in mitotic events in melanoma tumors. (A) qPCR analysis of mitotic genes cyclin B1, cdk1 and wee1 in healthy skin and tumors. Relative expression to the reference gene represents the mean ± SEM of minimum 5 samples per time point. (B) Quantification of mitotic events in healthy skin and tumors using an antibody to phospho-Histone H3 (pH3). Data represent the percentage of pH3-positive cells relative to the total number of cells in one section. Data represent the mean ± SEM of a minimum of 3 different fish. The percentage of pH3 positive cells were compared at each time point for skin and tumor using a one-way ANOVA test followed by a Newman-Keuls multiple comparison post test (*P < 0.05, ns = non significant).
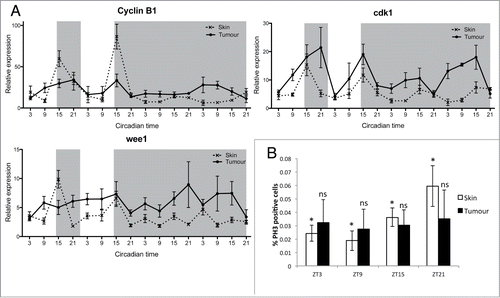
Figure 3. Disruption in mitotic events in melanoma tumors. (A) qPCR analysis of mitotic genes cyclin B1, cdk1 and wee1 in healthy skin and tumors. Relative expression to the reference gene represents the mean ± SEM of minimum 5 samples per time point. (B) Quantification of mitotic events in healthy skin and tumors using an antibody to phospho-Histone H3 (pH3). Data represent the percentage of pH3-positive cells relative to the total number of cells in one section. Data represent the mean ± SEM of a minimum of 3 different fish. The percentage of pH3 positive cells were compared at each time point for skin and tumor using a one-way ANOVA test followed by a Newman-Keuls multiple comparison post test (*P < 0.05, ns = non significant).

Figure 4. Disruption in S-phase gene expression in melanoma tumor. (A) qPCR analysis of S-phase regulating genes p21, cdk2, and PCNA in skin and tumor. Relative expression to the reference gene represents the mean ± SEM of a minimum of 5 samples per time point. (B) Cosinor analysis from qPCR values presented in (A). Data represent the mesor and amplitude in relative expression, the acrophase in circadian time and the significance of rhythmicity (*P < 0.05; ***P < 0.001) for skin and tumor in LD and DD regimes.
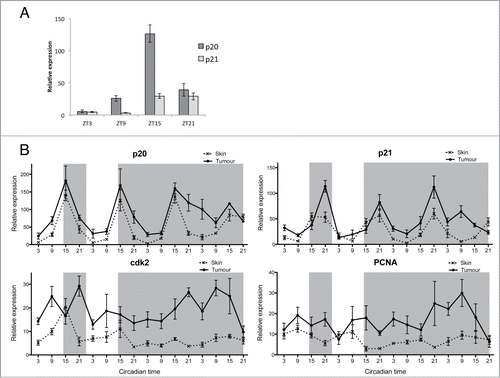
Figure 4. Disruption in S-phase gene expression in melanoma tumor. (A) qPCR analysis of S-phase regulating genes p21, cdk2, and PCNA in skin and tumor. Relative expression to the reference gene represents the mean ± SEM of a minimum of 5 samples per time point. (B) Cosinor analysis from qPCR values presented in (A). Data represent the mesor and amplitude in relative expression, the acrophase in circadian time and the significance of rhythmicity (*P < 0.05; ***P < 0.001) for skin and tumor in LD and DD regimes.