Figures & data
Figure 1. LOX-1 receptor model. Red cartoon and transparent surface representation of the protein with the double layer phospholipid membrane in spacefill. This picture was produced by using the program Chimera.Citation46
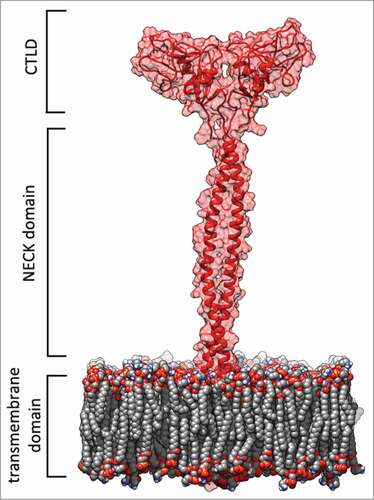
Figure 2. Detergent-free purification of caveolin-rich membrane fractions by sucrose gradient. (A) HEK-293 stably expressing LOX-1-V5 (clone 19) were treated or not with different statins, as indicated, for 3 d. Lysates were subjected to sucrose gradient centrifugation to isolate caveolin-enriched lipid rafts and immunoblotted with anti-V5 (α LOX-1)(left panel) and anti-caveolin (α Cav-1)(right panel). (B) Densitometric measurements of LOX-1 subunit band in fraction 5 derived from control or treated cells with 2.5 μM drug concentration. The data represent the average ± standard deviation (SD) of 3 separate experiments.
Figure 3. Effects of short exposure of statins on LOX-1 mediated ox-LDL binding. (A) COS cells transiently transfected with LOX-1-V5 were incubated with 10 μg/ml DiI-ox-LDL (red fluorescence) for 1 hour at 4°C in the absence (Ctrl) or in the presence of 2 μM lovastatin, fluvastatin or 4 μM atorvastatin. Nuclei are blue stained with Hoechst 33342. Scale bar 20 μm. (B) Histogram shows the percentage of red positive cells with respect of all Hoechst-positive nuclei incubated with 10 μg/ml DiI-ox-LDL without (Ctrl) or with 2 μM lovastatin, atorvastatin, fluvastatin and pravastatin for 1h at 37°C to measure ox-LDL internalization (uptake). (C) Percentage of DiI-ox-LDL red positive cells pre-treated (dashed line) or not (continuous line) with different concentration of lovastatin before the binding assay done in the presence of lovastatin (1h at 4°C). (D) Quantification of DiI-ox-LDL binding by spectrofluorometer. The data represent the mean ± standard deviation calculated from 4 separate experiments. A P value < 0.01 was considered statistically significant.
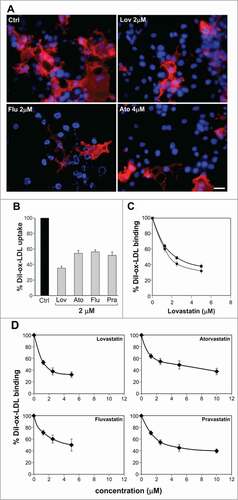
Figure 4. Schematic view of the interactions between statins and CTLD. The 2D depictions show hydrogen bonds as black dashed lines between the interaction partners on either side. Hydrophobic interactions are illustrated as smooth green contour lines between the respective amino acids and the ligand. Stacking interactions are indicated by green dashed lines between filled green circles. The ligand itself is drawn utilizing the 2D draw engine according to chemical drawing conventions. This image has been produced using the PoseView software.Citation64
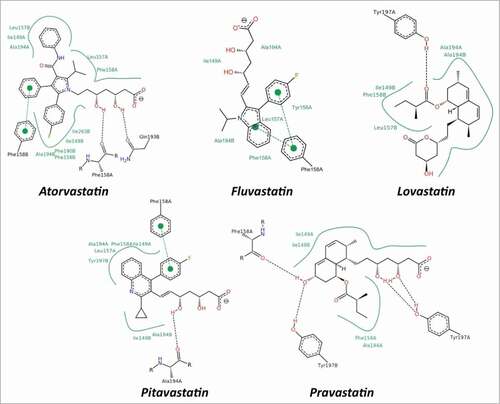
Table 1. Results of the CTLD – statins molecular docking analysis
Figure 5. RMSD analysis. (A) RMSD time dependence for the full LOX-1.apo (black line) and LOX-1.lig models (red line) simulations. (B) RMSD time dependence for the CTLD structures only. The black line indicates the CTLD in LOX-1.apo simulation while the red line shows the CTLD in LOX-1.lig simulation.
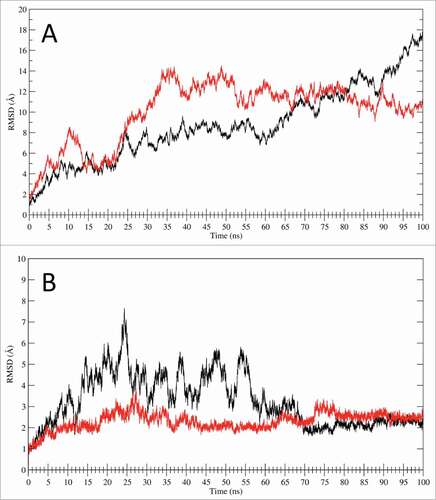
Figure 6. Inter-subunits distances. Histogram of distances between the mass centers of the 2 CTLD monomers: CTLD in LOX-1.apo (black bars) and CTLD in LOX-1.lig (red bars).
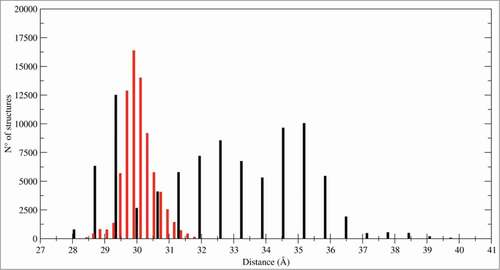
Figure 7. PCA analysis. Tube representation of the motion projections along the first eigenvector for (A) CTLD in LOX-1.apo and (B) CTLD in LOX-1.lig. The direction of the subunits motion is indicated by the black arrows and by the flanked tubes, the vs. being defined from red to blue. Arrows underline the direction of the motion. This picture has been produced using the program VMD.Citation47
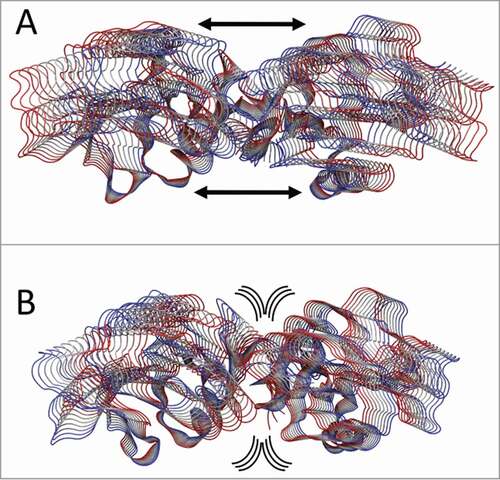
Figure 8. Dimers versus monomers ratio. (A) HEK-293 stably expressing LOX-1-V5 (clone #19) were treated or not with lovastatin and fluvastatin for 2 d. Figure shows the protein gel blot analysis of lipid rafts (fractions 4, 5 and 6) purified by sucrose gradient visualized with Mab anti-V5. (B) Western blot of sLOX-1 released in COS transfected culture medium. Equal volumes of medium derived from cells treated or not with different concentration of atorvastatin for 1 hour was TCA precipitated and analyzed by western blot. Samples were run in the absence or in the presence of 20 mM DTT and immunoreactive bands were visualized with Mab anti-V5. (C) Analysis of conditioned medium derived from human umbilical vein endothelial cells treated or not with ox-LDL. Samples were run in the presence of 20 mM DTT and immunoreactive bands visualized with rabbit anti-LOX-1 antibodies. The asterisk indicates a product of LOX-1 degradation, rarely present. D and M refers to dimers and monomers respectively.