Figures & data
Figure 1. (See previous page). Large tumor suppressors (Lats)1/2 phosphorylate CHO1-S716S717 during mitosis. (A) The primary structures of human and mouse CHO1 and human MKLP1. CC, coiled-coil domain. The Lats1/2 consensus sequences and phosphorylation sites are underlined and bold, respectively. (B) In vitro assays performed in the presence of [γ-32P] ATP using vector alone (control) or immunoprecipitated wild-type (WT) or kinase dead (KD) 6Myc-tagged Lats1 or Lats2, along with the expression of 3Flag-tagged Mob1A as a Lats1/2 activator. GST-fused truncated fragments (amino acids 692–796) of WT and S717A (SA) mutated MmCHO1-WT were used as substrates. (C) Immunoblot analyses of HeLa-S3 cells transfected with 6Myc-tagged vector alone, full-length MKLP1, or WT or S717A (SA) mutant MmCHO1. The cells were synchronized at the M phase by treatment with nocodazole. Asterisks indicate non-specific bands. (D) Immunoblot analyses of HeLa-S3 cells treated with mimosine (Mim), thymidine (Thy), taxol (Tax), nocodazole (Noc), or a thymidine single block-and-release (Thy+R10h). Control cells were asynchronous (Asy). The arrow indicates endogenous CHO1-pS716S717. For peptide competition assays, the anti-pS716S717 antibody was pre-incubated with phosphorylated (lanes 7–12) or non-phosphorylated (lanes 13–18) CHO1 antigen peptides. Asterisks indicate non-specific bands. Mcm2 is a marker of the G1 and S phases, whereas Aurora-A is a marker of the M phase. (E) Protein phosphatase (PPase) assay showing immunoblot analyses of endogenous CHO1-pS716S717 in HeLa-S3 cells synchronized with Tax, Noc, or Thy+R10h. The cell extracts were treated with or without 200 U of λPPase and PPase inhibitors. (F) Immunoblot analyses of HeLa-S3 cells transfected with siRNAs against Lats1 (#3509) or Lats2 (#581), and synchronized at mitosis by a thymidine single block-and-release (10 h). A GL2 (siRNA against firefly luciferase) was used as a negative control. The ratios of the band intensities of CHO1-pS716S717 to that in GL2 cells are shown.
![Figure 1. (See previous page). Large tumor suppressors (Lats)1/2 phosphorylate CHO1-S716S717 during mitosis. (A) The primary structures of human and mouse CHO1 and human MKLP1. CC, coiled-coil domain. The Lats1/2 consensus sequences and phosphorylation sites are underlined and bold, respectively. (B) In vitro assays performed in the presence of [γ-32P] ATP using vector alone (control) or immunoprecipitated wild-type (WT) or kinase dead (KD) 6Myc-tagged Lats1 or Lats2, along with the expression of 3Flag-tagged Mob1A as a Lats1/2 activator. GST-fused truncated fragments (amino acids 692–796) of WT and S717A (SA) mutated MmCHO1-WT were used as substrates. (C) Immunoblot analyses of HeLa-S3 cells transfected with 6Myc-tagged vector alone, full-length MKLP1, or WT or S717A (SA) mutant MmCHO1. The cells were synchronized at the M phase by treatment with nocodazole. Asterisks indicate non-specific bands. (D) Immunoblot analyses of HeLa-S3 cells treated with mimosine (Mim), thymidine (Thy), taxol (Tax), nocodazole (Noc), or a thymidine single block-and-release (Thy+R10h). Control cells were asynchronous (Asy). The arrow indicates endogenous CHO1-pS716S717. For peptide competition assays, the anti-pS716S717 antibody was pre-incubated with phosphorylated (lanes 7–12) or non-phosphorylated (lanes 13–18) CHO1 antigen peptides. Asterisks indicate non-specific bands. Mcm2 is a marker of the G1 and S phases, whereas Aurora-A is a marker of the M phase. (E) Protein phosphatase (PPase) assay showing immunoblot analyses of endogenous CHO1-pS716S717 in HeLa-S3 cells synchronized with Tax, Noc, or Thy+R10h. The cell extracts were treated with or without 200 U of λPPase and PPase inhibitors. (F) Immunoblot analyses of HeLa-S3 cells transfected with siRNAs against Lats1 (#3509) or Lats2 (#581), and synchronized at mitosis by a thymidine single block-and-release (10 h). A GL2 (siRNA against firefly luciferase) was used as a negative control. The ratios of the band intensities of CHO1-pS716S717 to that in GL2 cells are shown.](/cms/asset/364c0561-8242-49af-9358-d27aa6007f89/kccy_a_1026489_f0001_b.gif)
Figure 2. CHO1-pS716S717 localizes to centrosomes during mitosis. (A, B) Subcellular localizations of CHO1-pS716S717 (A) and CHO1 (B) in synchronized HeLa-S3 cells. Anti-CHO1[GS] is CHO1-specific antibody that recognizes the F-actin binding regions (FABR). (C) Peptide competition assay in which the anti-pS716S717 antibody was pre-incubated with phosphorylated (+) or non-phosphorylated (−) CHO1-S716S717 peptides prior to immunostaining. (D) Subcellular localization of CHO1-pS716S717 in metaphase large tumor suppressor (Lats)1 KO/HeLa-S3, Lats2 KO/HeLa-S3, and parental HeLa-S3 cells synchronized at mitosis by a thymidine single block-and-release (10 h). (E) Subcellular localization of metaphase CHO1-pS716S717 in HeLa-S3 cells that were transfected with siRNAs against the common 3′-UTR of CHO1 and MKLP1 and synchronized at mitosis by a thymidine single block-and-release (10 h). The GL2 siRNA was used as a negative control. The graph shows the pixel intensity of pS716 signals at the centrosome. Data represent the mean ± SD of n = 3 experiments. (F) Localizations of the pS716S717 and pS814S807 versions of CHO1 and/or MKLP1 in HeLa-S3 cells undergoing mitosis. A–F. Scale bar, 10 μm. (G) Overview of the subcellular localizations of CHO1-pS716S717 and CHO1-pS814S807/MKLP1-pS710 during the cell cycle. (H) Immunoblot analyses of exogenous CHO1-pS716S717 in HeLa-S3 cells that were transfected with 6Myc-tagged full-length MmCHO1-WT (wild type),-SA (S717A),-2SA (S805A, S807A) or-3SA (S717A, S805A, S807A), and treated with (Noc.) or without (Ctl.) nocodazole (80 ng/ml) for 18h.
![Figure 2. CHO1-pS716S717 localizes to centrosomes during mitosis. (A, B) Subcellular localizations of CHO1-pS716S717 (A) and CHO1 (B) in synchronized HeLa-S3 cells. Anti-CHO1[GS] is CHO1-specific antibody that recognizes the F-actin binding regions (FABR). (C) Peptide competition assay in which the anti-pS716S717 antibody was pre-incubated with phosphorylated (+) or non-phosphorylated (−) CHO1-S716S717 peptides prior to immunostaining. (D) Subcellular localization of CHO1-pS716S717 in metaphase large tumor suppressor (Lats)1 KO/HeLa-S3, Lats2 KO/HeLa-S3, and parental HeLa-S3 cells synchronized at mitosis by a thymidine single block-and-release (10 h). (E) Subcellular localization of metaphase CHO1-pS716S717 in HeLa-S3 cells that were transfected with siRNAs against the common 3′-UTR of CHO1 and MKLP1 and synchronized at mitosis by a thymidine single block-and-release (10 h). The GL2 siRNA was used as a negative control. The graph shows the pixel intensity of pS716 signals at the centrosome. Data represent the mean ± SD of n = 3 experiments. (F) Localizations of the pS716S717 and pS814S807 versions of CHO1 and/or MKLP1 in HeLa-S3 cells undergoing mitosis. A–F. Scale bar, 10 μm. (G) Overview of the subcellular localizations of CHO1-pS716S717 and CHO1-pS814S807/MKLP1-pS710 during the cell cycle. (H) Immunoblot analyses of exogenous CHO1-pS716S717 in HeLa-S3 cells that were transfected with 6Myc-tagged full-length MmCHO1-WT (wild type),-SA (S717A),-2SA (S805A, S807A) or-3SA (S717A, S805A, S807A), and treated with (Noc.) or without (Ctl.) nocodazole (80 ng/ml) for 18h.](/cms/asset/4401ff84-3a0d-4844-aacb-037db3417e89/kccy_a_1026489_f0002_c.jpg)
Figure 3. CHO1-pS716S717 interacts with LIM-kinase 1 (LIMK1). (A) Schematic illustrations of phosphorylated wild-type (WT) and mutant CHO1 (SA, SD, 2SA, 3SA). (B) Immunoblot analyses showing the requirement for pS716S717 for the physical interaction of CHO1 with LIMK1. HeLa-S3 cells were co-transfected with 3Flag-LIMK1 and a 6Myc-tagged MKLP1 or full-length MmCHO1-WT, -SA, -SD, -2SA, or -3SA. (C) Overview of the CHO1 and LIMK1 deletion mutants and their interactions. (D) Immunoblot analyses of lysates of HeLa-S3 cells co-expressing 3Flag-LIMK1 and 6Myc-full-length MmCHO1 or the indicated deletion mutants, showing the physical interaction of full-length LIMK1 with the stalk domain of CHO1. (E) Immunoblot analyses of lysates of HeLa-S3 cells co-expressing 3Flag-CHO1 and 6Myc-tagged full-length LIMK1 or the indicated deletion mutants, showing the physical interaction of full-length CHO1 with the LIM domain of LIMK1.
Figure 4 (See previous page). Large tumor suppressor (Lats)1/2 and CHO1 regulate the centrosomal localization and activity of LIM-kinase (LIMK)1 during mitosis. (A) Centrosomal localization of LIMK1-pT508 in metaphase HeLa-S3 cells transfected with a control (GL2) or CHO1/MKLP1-specific siRNA and synchronized by a thymidine single block-and-release (10 h). Scale bar, 10 μm. (B, C) The signal intensities of LIMK1-pT508 (B) and γ-tubulin (C) on centrosomes in CHO1/MKLP1 knockdown cells during metaphase. Data represent the mean ± SD of n = 3 independent experiments (30 cells per experiment). (D) Centrosomal localization of phosphorylated LIMK1-pT508 and γ-tubulin in metaphase HeLa-S3 cells transfected with a control (GL2), Lats1-or Lats2-specific siRNA. Lats2 knockout cells (KO/HeLa-S3) were also transfected with Lats1 siRNA. The cells were synchronized by a thymidine single block-and-release (10 h). Scale bar, 10 μm. (E, F) The signal intensities of LIMK1-pT508 (E) and γ-tubulin (F) on the centrosomes in Lats1-, Lats2-, and Lats1/2-depleted cells during metaphase. Data represent the mean ± SD of n = 3 independent experiments (30 cells per experiment). (G) Immunoblot analyses of Cofilin-pS3 in HeLa-S3 cells transfected with a control (GL2) or CHO1/MKLP1-specific siRNA and synchronized by a thymidine single block-and-release (10 h). The ratio of the amount of Cofilin-pS3 in CHO1/MKLP1 knockdown cells to that in control cells is shown. (H) Immunoblot analyses of Cofilin-pS3 in HeLa-S3 cells transfected with a control (GL2), Lats1-, or Lats2-specific siRNA and synchronized by a thymidine single block-and-release (10 h). (I) Immunoblot analyses of Cofilin-pS3 in asynchronous parental HeLa-S3 cells, Lats1 KO/HeLa-S3 cells, Lats2 KO/HeLa-S3 cells, and Lats2 KO/HeLa-S3 cells transfected with Lats1 siRNA.
Figure 5 (See previous page). Phosphorylation of CHO1 at S716S717 is required for the anchoring and activation of LIM-kinase 1 (LIMK1) on the centrosome. (A) Centrosomal localization of LIMK1-pT508 and γ-tubulin in metaphase HeLa-S3 cells stably expressing vector alone or 6Myc-tagged CHO1-WT, -SA (S717A), or -SD (S717D). The cells were synchronized by a thymidine single block-and-release (10 h). Scale bar, 10 μm. The insets show enlarged images of signals at the centrosome. (B, C) The signal intensities of LIMK1-pT508 (B) and γ-tubulin (C) on centrosomes in metaphase HeLa-S3 cells stably expressing the constructs described in (A). Data represent the mean ± SD of n = 3 independent experiments (30 cells per experiment). (D, E) The signal intensities of Aurora-A-pT288 on centrosomes in G2 phase (D) and metaphase (E) HeLa-S3 cells stably expressing the constructs described in (A). Cells were synchronized by a thymidine single block-and-release (10 h). Data represent the mean ± SD of n = 3 independent experiments (30 cells per experiment). (F) The mitotic spindle in metaphase HeLa-S3 cells stably expressing the constructs described in (A). Cells were synchronized by a thymidine single block-and-release (10 h) and stained with anti-α-tubulin. Scale bar, 10 μm. (G) The percentages of the cells described in (F) with a mitotic spindle during metaphase. The cells were classified according to the α-tubulin signal intensity. Data represent the mean ± SD of n = 3 experiments. (H, I) The centrosomal localization of LIMK1-pT508 in anaphase HeLa-S3 cells stably expressing the constructs described in (A). In (I), the data represent the mean ± SD of n = 3 independent experiments (30 cells per experiment). (J) The level of Cofilin-pS3 in metaphase HeLa-S3 cells stably expressing the constructs described in (A). Cells were synchronized by a thymidine single block-and-release (10 h). Scale bar, 10 μm.
Figure 6. Phosphorylation of CHO1 at S716S717 is required for cytokinesis. (A) The percentages of multinucleated cells in HeLa-S3 populations stably expressing 6Myc-vector or 6Myc-CHO1-WT (wild type) that were transfected with a control (GL2) or CHO1/MKLP1-specific siRNA. The cells were fixed 72 h after transfection. (B) Representative images of immunostained multinucleated cells (including binucleated cells). (C) The percentages of multinucleated cells in a HeLa-S3 population stably expressing 6Myc-tagged vector alone or CHO1-WT, -SA, -SD, -2SA, or -3SA. (D) The percentages of multinucleated cells in Lats1-KO mouse embryo fibroblasts (MEFs) transfected with 6Myc-tagged vector alone, large tumor suppressor (Lats)1-WT, or CHO1-WT. The cells were fixed 72 h after transfection. (E) The percentages of HeLa-S3 cells stably expressing 6Myc-tagged vector alone, CHO1-WT, -SA, or -SD at each stage of the cell cycle. The cells were synchronized by a thymidine single block-and-release (10 h). (F) The centrosomal localization of LIM-kinase 1 (LIMK1)-pT508 in G2 phase HeLa-S3 cells stably expressing 6Myc-tagged vector alone or CHO1-WT, -SA, or -SD. The cells were synchronized by a thymidine single block-and-release (10 h). Scale bar, 10 μm. The bar graphs show the intensities of the LIMK1-pT508 (center) and γ-tubulin (right) signals on the centrosomes in the G2 phase. Data represent the mean ± SD of n = 3 independent experiments (30 cells per experiment). (G) Immunoblot analyses of Cofilin-pS3 in HeLa-S3 cells transiently expressing 6Myc-tagged vector alone or CHO1-WT, -SA, or -SD. Transfected HeLa-S3 cells were treated with nocodazole (80 ng/ml) for 16 h prior to releasing for 2 h with (+) or without (−) MG132 (5 nM). (H) Midbody localization (arrow) of ectopic 6Myc-CHO1-SA in HeLa-S3 cells undergoing cytokinesis. The asterisks indicate mislocalization of CHO1-SA. Scale bar, 10 μm. The bar graph shows the percentages of cells expressing 6Myc-tagged vector alone or CHO1-WT, -SA or -SD with midbody localization of the exogenous protein during late telophase. (I) Midbody localization of Ect2 during cytokinesis in HeLa-S3 cells stably expressing 6Myc-tagged vector alone or CHO1-WT, -SA, or -SD. The arrow indicates mislocalization of Ect2. Scale bar, 10 μm. The bar graph shows the percentages of cells undergoing cytokinesis with midbody Ect2 signals. (B–E, H, I) Data represent the mean ± SD of n = 3 experiments (more than 100 cells per experiment).
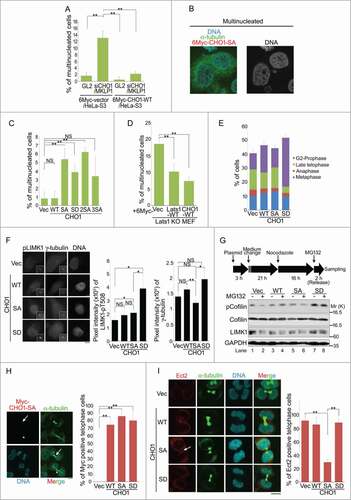
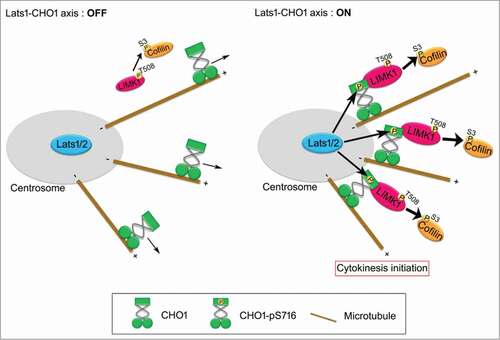
Figure 7. A model for the role of Lats1/2-CHO1-LIMK1 axis in preparation of cytokinesis initiation on centrosome. When Lats1/2-CHO1 axis is activated, LIMK1 is anchored to centrosomes by S716-phosphorylated CHO1, which in turn efficiently activates LIMK1 and promotes phosphorylation of Cofilin for preparation of cytokinesis initiation (right panel). If Lats1/2-CHO1 axis is not activated, CHO1 does not localize at centrosome, thereby decreasing the activating phosphorylation level and activation of LIMK1 to phosphorylate Cofilin (left panel). Eventually, dysregulation of Lats1/2-CHO1 axis fails to initiate cytokinesis.