Figures & data
Figure 1. IGF1 induces PKM2 Ser/Thr phosphorylation. (A) Serum starved Calu-1 cells were stimulated with IGF1 10 nM for the indicated times and then lysed. Equal amount of cell lysates were immunoprecipitated (IP) and immunoblotted (IB) with the indicated antibodies. (B) Equal amount of cell lysates were separated on SDS-PAGE, transferred on nitrocellulose and blotted with an antibody direct against total PKM2, P(Tyr 980)IGFIR⇓, total IGFIR, P(Ser 473)-Akt, total Akt, P(Thr202/Tyr204)-ERK, total ERK proteins.
Figure 2. IGF1 decreases cellular pyruvate kinase activity and increases AMP/ATP ratio. (A and B) report the assay of pyruvate kinase (PK) and glucose 6 phosphate dehydrogenase activity (G6PD) respectively after several time-points of IGF1 incubation in the Calu-1 homogenate. Enzymatic activities are expressed as U/min/mg, and represent al least 5 experiments for each value. (C) AMP and ATP concentrations were determined by enzymatic assay and the AMP/ATP ratio was then calculated. The * indicates that the value is statistically different from that of the control (0 min) for P < 0.01.
Figure 3. IGF1 increases the formation of dimeric PKM2. Calu-1 cells were treated with IGF1 for 20 minutes and then subjected to size-exclusion chromatography. (A) Total cell lysates were separated by size-exclusion chromatography to identificate PKM2 tetrameric (fraction 7) and dimeric form (fraction 13). (B) Fractions 7 and 13 were separated on SDS-PAGE, transferred on nitrocellulose and blotted with an antibody direct against PKM2.
Figure 4. PKM2 nuclear localization in presence of IGF1. (A) Cells were immunostained with anti PKM2 (PKM2 red). The nucleus is labeled with DAPI (blue). Merged images are shown (PKM2+ Nucleus). IGF1 induces the nuclear translocation of PKM2 in the nuclear compartment already after 20 minutes. (B) Calu-1 cells were treated with IGF1 for the indicated times. Nuclear and cytosolic lysates were prepared by cell fractionation and subjected to immunoblotting analysis using an anti human STAT3, PKM2, H3 and G3PDH primary antibodies. Densitometric analysis was performed using ImageJ software. The * indicates that the value is statistically different to that of control (0 min) for P < 0.01.
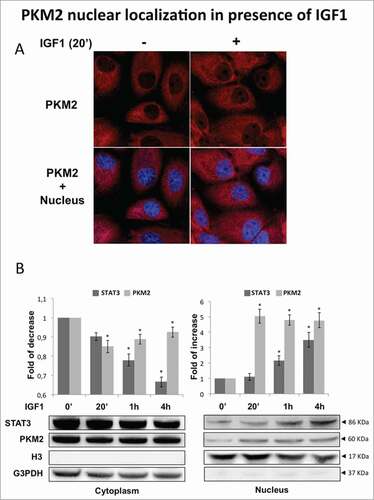
Figure 5. IGF1 regulates PKM2 function through Akt phosphorylation. (A) Calu-1 cells were treated by IGF1, IGF1 in presence of LY294002 or alternatively U126. Representative immunoprecipitation experiment showing PKM2 Ser/Thr phosphorylation. Total cell lysates were subjected to immunoblotting analysis using specific antibodies against phospho Akt, Akt, phospho ERK1/2 and ERK1/2. (B) Measure of PK activity in Calu-1 homogenate, incubated with IGF1, IGF1 + U126 or IGF1 + LY, respectively. The enzymatic activity is expressed as U/min/mg, and represent al least 5 experiments for each value. The * indicates that the value is statistically different to that of control (0 min) for P < 0.01.
Figure 6. IGF1 increases FGD uptake in Calu-1 cells. Calu-1 cells were treated by IGF1 for 24 hours. (A) Western blot analysis of Calu-1 total cell lysates probed with specific antibodies for HK2, HIF1α and GLUT1 and β-Actin. (B) Cell uptake of FDG was expressed as percentage of total tracer availability according to different IGF1 concentrations. p values are shown for each comparison: * P < 0.05; ** P < 0.01.
Figure 7. Metformin counteracts the IGF1 effect on FGD uptake and pyruvate kinase activity. Calu-1 cells were treated with IGF1 (10 nM), Metformin (10 mM) o IGF1 (10 nM)/Metformin (10 mM) for the indicated times. (A) FDG uptake at 24h of treatment was expressed as percentage of total tracer availability. (B) Pyruvate kinase assay expressed as percentage of the pyruvate kinase activity value obtained at 0 min of each treatment. (C) Representative immunoblot of Calu-1 cell lysates showing IGF1 upregulation of HIF1α, HK2 and GLUT1 at 24 h and 48 h. (D–F) Densitometric analysis was performed using ImageJ software. p values are shown for each comparison: * P < 0.05.

Figure 8. IGF1 meets metabolism regulating PKM2 Ser/Thr phosphorylation. IGF1 induced Akt phosphorylation and then Ser/Thr PKM2 phosphorylation in a sequential manner. The increase of PKM2 dimers and the decrease of pyruvate kinase activity are associated to PKM2 nuclear localization. This results in the up regulation of genes involved in glucose uptake such as HIF1 α, GLUT1, HK2. This transcriptional effect potentiate glucose uptake induced by IGF1.