2,255
Views
67
CrossRef citations to date
0
Altmetric
Report

Sirt3 prevents maternal obesity-associated oxidative stress and meiotic defects in mouse oocytes

, , , , , , , , & show all
Pages 2959-2968 | Received 23 Jan 2015, Accepted 01 Mar 2015, Published online: 20 Aug 2015

Figures & data

Figure 1. Increased ROS levels and reduced Sirt3 expression in oocytes from HFD mice. Ovulated MII oocytes were collected from mice fed a high fat diet or control diet, and then processed for evaluation of ROS levels via CM-H2DCFDA staining and Sirt3 expression by immunoblotting. (A) Representative images of CM-H2DCFDA fluorescence in oocytes from control and HFD mice. Scale bar: 50 µm. (B) Quantitative analysis of fluorescence intensity shown in panel A. Data were standardized by dividing each value by the average value of the control group in each experiment. Error bars indicate ± SD. (n = 70 oocytes for control and 60 for HFD pooled from 3 replicates). *P < 0.05 vs control. (C) Western blot analysis showed the reduced Sirt3 expression in oocytes from HFD mice compared to controls (100 oocytes were used for each group). Actin served as an internal control. Band intensity was calculated using ImageJ software, and the ratio of Sirt3/Actin expression was normalized and values are indicated. All protein gel blot experiments were repeated at least 3 times, with a representative gel image shown.

Figure 1. Increased ROS levels and reduced Sirt3 expression in oocytes from HFD mice. Ovulated MII oocytes were collected from mice fed a high fat diet or control diet, and then processed for evaluation of ROS levels via CM-H2DCFDA staining and Sirt3 expression by immunoblotting. (A) Representative images of CM-H2DCFDA fluorescence in oocytes from control and HFD mice. Scale bar: 50 µm. (B) Quantitative analysis of fluorescence intensity shown in panel A. Data were standardized by dividing each value by the average value of the control group in each experiment. Error bars indicate ± SD. (n = 70 oocytes for control and 60 for HFD pooled from 3 replicates). *P < 0.05 vs control. (C) Western blot analysis showed the reduced Sirt3 expression in oocytes from HFD mice compared to controls (100 oocytes were used for each group). Actin served as an internal control. Band intensity was calculated using ImageJ software, and the ratio of Sirt3/Actin expression was normalized and values are indicated. All protein gel blot experiments were repeated at least 3 times, with a representative gel image shown.

Figure 2. Effects of Sirt3 knockdown on ROS generation in oocytes. (A) Oocytes at GV and metaphase stages were immunolabeled with Sirt3 antibody (green) and counterstained with Hoechst 33342 (blue). Arrowheads point to Sirt3 signals. Scale bar: 20 μm. (B) Extent of knockdown of endogenous Sirt3 protein expression after Sirt3 morpholino (Sirt3-MO) injection was assessed by western blot analysis (100 oocytes were used for each group). Western blot experiments were repeated at least 3 times, with a representative gel image shown. (C) Representative images of CM-H2DCFDA fluorescence in control and Sirt3-MO oocytes. Scale bar: 50 μm. (D) Quantitative analysis of fluorescence intensity shown in C. Error bars indicate ± SD. (In the analysis, n = 120 oocytes for control and 110 for Sirt3 group were included, and pooled from 3 replicates). *P < 0.05 vs control.
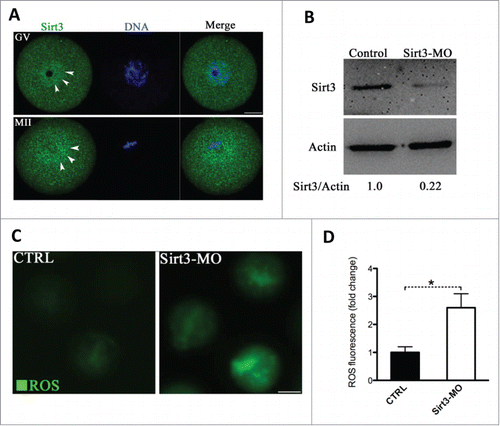
Figure 2. Effects of Sirt3 knockdown on ROS generation in oocytes. (A) Oocytes at GV and metaphase stages were immunolabeled with Sirt3 antibody (green) and counterstained with Hoechst 33342 (blue). Arrowheads point to Sirt3 signals. Scale bar: 20 μm. (B) Extent of knockdown of endogenous Sirt3 protein expression after Sirt3 morpholino (Sirt3-MO) injection was assessed by western blot analysis (100 oocytes were used for each group). Western blot experiments were repeated at least 3 times, with a representative gel image shown. (C) Representative images of CM-H2DCFDA fluorescence in control and Sirt3-MO oocytes. Scale bar: 50 μm. (D) Quantitative analysis of fluorescence intensity shown in C. Error bars indicate ± SD. (In the analysis, n = 120 oocytes for control and 110 for Sirt3 group were included, and pooled from 3 replicates). *P < 0.05 vs control.

Figure 3. Sirt3 overexpression attenuates the ROS production in oocytes from HFD mice. (A) Cartoon summarizing the experimental protocol to investigate the effects of Sirt3 overexpression on ROS production and meiotic structures in oocytes. PBS or exogenous Myc-Sirt3 mRNA (overexpression group) was microinjected into GV oocytes from HFD mice, which were arrested for 20 hours with milrinone to allow synthesis of new Myc-Sirt3 protein. (B) Western blot analysis showing that exogenous Myc-Sirt3 protein was efficiently overexpressed, probing with anti-Myc Tag antibody. (C) Representative images of CM-H2DCFDA fluorescence in control, HFD, HFD+PBS and HFD+Sirt3 MII oocytes. Scale bar: 100 μm. (D) Quantitative analysis of fluorescence intensity shown in C. 106 oocyte for CTRL group, 118 oocytes for HFD group, 110 oocytes for HFD+PBS group and 115 oocytes for HFD+Sirt3 group were analyzed. Error bars indicate ± SD. Different superscripts indicate significant values (P < 0.05).
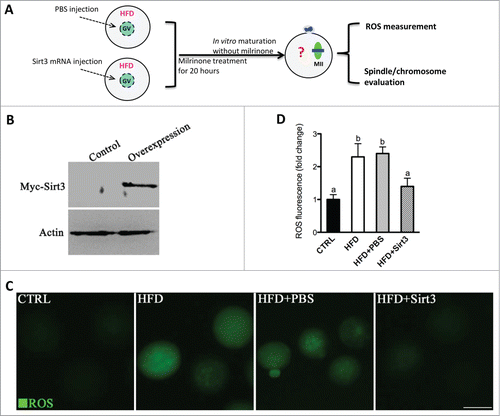
Figure 3. Sirt3 overexpression attenuates the ROS production in oocytes from HFD mice. (A) Cartoon summarizing the experimental protocol to investigate the effects of Sirt3 overexpression on ROS production and meiotic structures in oocytes. PBS or exogenous Myc-Sirt3 mRNA (overexpression group) was microinjected into GV oocytes from HFD mice, which were arrested for 20 hours with milrinone to allow synthesis of new Myc-Sirt3 protein. (B) Western blot analysis showing that exogenous Myc-Sirt3 protein was efficiently overexpressed, probing with anti-Myc Tag antibody. (C) Representative images of CM-H2DCFDA fluorescence in control, HFD, HFD+PBS and HFD+Sirt3 MII oocytes. Scale bar: 100 μm. (D) Quantitative analysis of fluorescence intensity shown in C. 106 oocyte for CTRL group, 118 oocytes for HFD group, 110 oocytes for HFD+PBS group and 115 oocytes for HFD+Sirt3 group were analyzed. Error bars indicate ± SD. Different superscripts indicate significant values (P < 0.05).

Figure 4. Sirt3 overexpression ameliorates the meiotic defects in oocytes from HFD mice. (A) MII oocytes were stained with α-tubulin antibody to visualize the spindle (green) and counterstained with Hoechst 33342 to visualize chromosomes (blue). Normal metaphase oocytes present a typical barrel-shape spindle and well-aligned chromosomes on the metaphase plate. Spindle defects and chromosome misalignment are indicated by arrows and arrowheads, respectively. Representative confocal sections are shown. (B) Quantification of control (n = 180), HFD (n = 182), HFD+PBS (n = 196) and HFD+Sirt3 (n = 203) MII oocytes with spindle defects or chromosome misalignment. Data are expressed as mean percentage ± SD from 3 independent experiments. Different superscripts indicate significant values (P < 0.05). Scale bar: 30 µm.
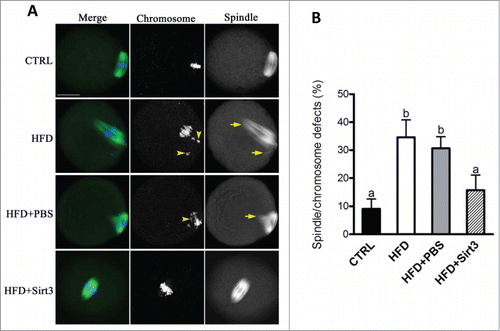
Figure 4. Sirt3 overexpression ameliorates the meiotic defects in oocytes from HFD mice. (A) MII oocytes were stained with α-tubulin antibody to visualize the spindle (green) and counterstained with Hoechst 33342 to visualize chromosomes (blue). Normal metaphase oocytes present a typical barrel-shape spindle and well-aligned chromosomes on the metaphase plate. Spindle defects and chromosome misalignment are indicated by arrows and arrowheads, respectively. Representative confocal sections are shown. (B) Quantification of control (n = 180), HFD (n = 182), HFD+PBS (n = 196) and HFD+Sirt3 (n = 203) MII oocytes with spindle defects or chromosome misalignment. Data are expressed as mean percentage ± SD from 3 independent experiments. Different superscripts indicate significant values (P < 0.05). Scale bar: 30 µm.

Figure 5. Acetylation of SOD2 lysine 68 controlled by Sirt3 functions in ROS generation in oocytes. (A) Acetylation-mimetic mutant SOD2(K53Q), SOD2(K68Q) or SOD2(K89Q) was microinjected into fully grown oocytes to evaluate the ROS levels via CM-H2DCFDA staining. Representative fluorescent images are shown. (B) Quantitative analysis of fluorescence intensity shown in A. Error bars indicate ± SD. At least 60 oocytes for each group were analyzed, and the experiments were conducted 3 times. (C) Control and Sirt3-MO MII oocytes were labeled with acetyl-SOD2K68 antibody (green) and counterstained with Hoechst 33342 for DNA (blue) to examine the effects of Sirt3 knockdown on acetylation status of SOD2K68 in oocytes. (D) Quantitative analysis of fluorescence intensity shown in C. Error bars indicate ± SD (n = 90 oocytes for control and 75 for Sirt3 group pooled from 3 replicates). Different superscripts indicate significant values (P < 0.05). Scale bars: 50 µm.
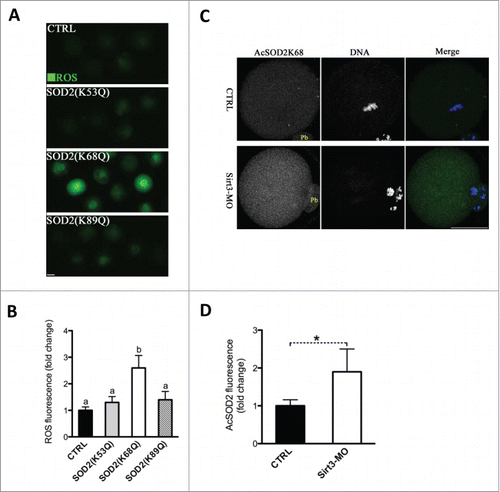
Figure 5. Acetylation of SOD2 lysine 68 controlled by Sirt3 functions in ROS generation in oocytes. (A) Acetylation-mimetic mutant SOD2(K53Q), SOD2(K68Q) or SOD2(K89Q) was microinjected into fully grown oocytes to evaluate the ROS levels via CM-H2DCFDA staining. Representative fluorescent images are shown. (B) Quantitative analysis of fluorescence intensity shown in A. Error bars indicate ± SD. At least 60 oocytes for each group were analyzed, and the experiments were conducted 3 times. (C) Control and Sirt3-MO MII oocytes were labeled with acetyl-SOD2K68 antibody (green) and counterstained with Hoechst 33342 for DNA (blue) to examine the effects of Sirt3 knockdown on acetylation status of SOD2K68 in oocytes. (D) Quantitative analysis of fluorescence intensity shown in C. Error bars indicate ± SD (n = 90 oocytes for control and 75 for Sirt3 group pooled from 3 replicates). Different superscripts indicate significant values (P < 0.05). Scale bars: 50 µm.
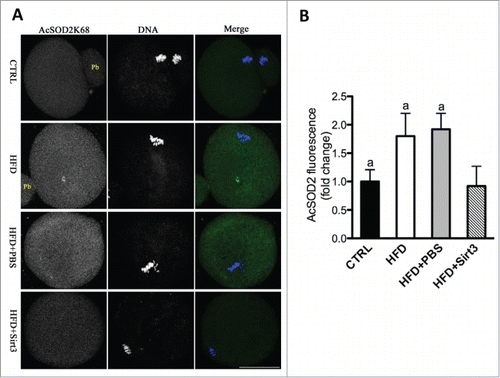
Figure 6. Sirt3 overexpression reduces the acetylation levels of SOD2K68 in oocytes from HFD mice. (A) Control, HFD, HFD+PBS and HFD+Sirt3 MII oocytes were stained with acetyl-SOD2K68 antibody (green) and counterstained with Hoechst 33342 for DNA (blue). Representative confocal sections are shown. (B) Quantitative analysis of fluorescence intensity shown in A. Error bars indicate ± SD (n = 105 oocytes for CTRL, 114 oocytes for HFD, 108 oocyte for HFD+PBS and 120 oocytes for HFD+Sirt3 group pooled from 3 replicates). Different superscripts indicate significant values (P < 0.05). Scale bars: 50 µm.

Figure 6. Sirt3 overexpression reduces the acetylation levels of SOD2K68 in oocytes from HFD mice. (A) Control, HFD, HFD+PBS and HFD+Sirt3 MII oocytes were stained with acetyl-SOD2K68 antibody (green) and counterstained with Hoechst 33342 for DNA (blue). Representative confocal sections are shown. (B) Quantitative analysis of fluorescence intensity shown in A. Error bars indicate ± SD (n = 105 oocytes for CTRL, 114 oocytes for HFD, 108 oocyte for HFD+PBS and 120 oocytes for HFD+Sirt3 group pooled from 3 replicates). Different superscripts indicate significant values (P < 0.05). Scale bars: 50 µm.

Figure 7. Deacetylation-mimetic mutant SOD2K68R prevents oxidative stress and meiotic defects in oocytes from HFD mice. (A) Cartoon summarizing the experimental protocol to investigate the role of SOD2K68 acetylation in oocyte meiosis and ROS homeostasis. SOD2 WT or SOD2(K68R) mutant mRNA was microinjected into GV oocytes from HFD mice, which were arrested for 20 hours with milrinone to allow synthesis of new proteins and then matured in vitro. (B) Control, HFD, HFD+SOD2 and HFD+SOD2(K68R) MII oocytes were then stained with CM-H2DCFDA to evaluate ROS production. Representative fluorescent images are shown. (C) Quantitative analysis of fluorescence intensity shown in B (n = 110 oocytes for CTRL, 102 oocytes for HFD, 106 oocyte for HFD+PBS and 110 oocytes for HFD+Sirt3 group). (D) Control, HFD, HFD+SOD2 and HFD+SOD2(K68R) MII oocytes were stained with α-tubulin antibody to visualize the spindle (green) and counterstained with Hoechst 33342 to visualize chromosomes (blue). Spindle defects and chromosome misalignment were indicated by arrows and arrowheads, respectively. Representative confocal sections are shown. (E) Quantification of Control (n = 176), HFD (n = 185), HFD+SOD2 (n = 178) and HFD+SOD2(K68R) (n = 192) oocytes with spindle defects or chromosome misalignment. All experiments were conducted 3 times, error bars indicate ± SD. Different superscript letters indicate significant differences (P < 0.05). Scale bars: 50 µm.
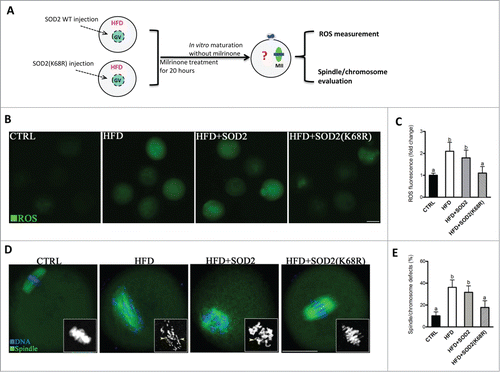
Figure 7. Deacetylation-mimetic mutant SOD2K68R prevents oxidative stress and meiotic defects in oocytes from HFD mice. (A) Cartoon summarizing the experimental protocol to investigate the role of SOD2K68 acetylation in oocyte meiosis and ROS homeostasis. SOD2 WT or SOD2(K68R) mutant mRNA was microinjected into GV oocytes from HFD mice, which were arrested for 20 hours with milrinone to allow synthesis of new proteins and then matured in vitro. (B) Control, HFD, HFD+SOD2 and HFD+SOD2(K68R) MII oocytes were then stained with CM-H2DCFDA to evaluate ROS production. Representative fluorescent images are shown. (C) Quantitative analysis of fluorescence intensity shown in B (n = 110 oocytes for CTRL, 102 oocytes for HFD, 106 oocyte for HFD+PBS and 110 oocytes for HFD+Sirt3 group). (D) Control, HFD, HFD+SOD2 and HFD+SOD2(K68R) MII oocytes were stained with α-tubulin antibody to visualize the spindle (green) and counterstained with Hoechst 33342 to visualize chromosomes (blue). Spindle defects and chromosome misalignment were indicated by arrows and arrowheads, respectively. Representative confocal sections are shown. (E) Quantification of Control (n = 176), HFD (n = 185), HFD+SOD2 (n = 178) and HFD+SOD2(K68R) (n = 192) oocytes with spindle defects or chromosome misalignment. All experiments were conducted 3 times, error bars indicate ± SD. Different superscript letters indicate significant differences (P < 0.05). Scale bars: 50 µm.
Supplemental material

1026517_Supplemental_Files.pdf

Download PDF (121.5 KB)

Reprints and Corporate Permissions

Please note: Selecting permissions does not provide access to the full text of the article, please see our help page How do I view content?

To request a reprint or corporate permissions for this article, please click on the relevant link below:

Academic Permissions

Please note: Selecting permissions does not provide access to the full text of the article, please see our help page How do I view content?

Obtain permissions instantly via Rightslink by clicking on the button below:

If you are unable to obtain permissions via Rightslink, please complete and submit this Permissions form. For more information, please visit our Permissions help page.