1,114
Views
6
CrossRef citations to date
0
Altmetric
Extra View

Human ACAP2 is a homolog of C. elegans CNT-1 that promotes apoptosis in cancer cells

, , &
Pages 1771-1778 | Received 30 Jan 2015, Accepted 01 Mar 2015, Published online: 17 Jun 2015

Figures & data

Table 1 Human homologues of functional caspase targets in C. elegans. A summary of identified caspase substrates and caspase downstream events important for cell death execution in C. elegans and humans

Figure 1. ACAP2 is a mammalian homolog of CNT-1. (A) Sequence alignment of 2 C. elegans CNT-1 isoforms (CNT-1a and CNT-1b) with human ACAP2 and ACAP3. Residues that are identical in all 4 proteins are shaded in yellow and residues that are identical in 3 of the 4 proteins are shaded in blue. The PH domain is underlined. The black arrowhead indicates the conserved lysine residue critical for lipid binding. The red arrow indicates the CED-3 cleavage site in CNT-1. (B) Schematic alignment of ACAP2 with CNT-1a with conservation information.
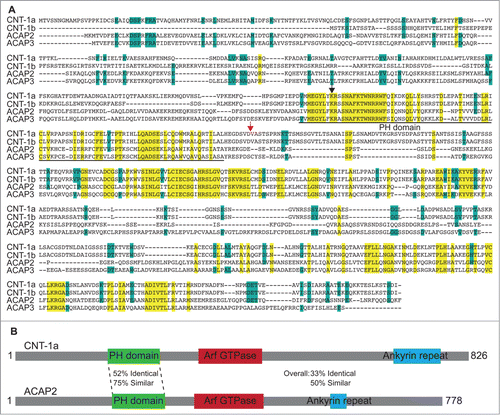
Figure 1. ACAP2 is a mammalian homolog of CNT-1. (A) Sequence alignment of 2 C. elegans CNT-1 isoforms (CNT-1a and CNT-1b) with human ACAP2 and ACAP3. Residues that are identical in all 4 proteins are shaded in yellow and residues that are identical in 3 of the 4 proteins are shaded in blue. The PH domain is underlined. The black arrowhead indicates the conserved lysine residue critical for lipid binding. The red arrow indicates the CED-3 cleavage site in CNT-1. (B) Schematic alignment of ACAP2 with CNT-1a with conservation information.

Figure 2. ACAP2 has an identical lipid-binding pattern to that of CNT-1. (A) Neither ACAP2 nor ACAP3 is cleaved by caspase-3 in vitro. PARP, ACAP2 and ACAP3 were synthesized and labeled with S35-Methionine(*) in rabbit reticulocyte lysate, incubated with or without 1 unit of purified caspase-3 for 2 hours, and then resolved by 15% SDS-PAGE. (B) ACAP2 and ACAP3 are not cleaved during apoptosis. HCT116 cells were treated with DMSO or 375 μM 5FU for 24 hours and cell lysates subjected to immunoblotting. ACAP2 and ACAP3 are not cleaved during apoptosis, whereas Caspase-3, Caspase-8, and PARP are. Nucleolin serves as a loading control. (C) ACAP2, but not ACAP3, displays a similar phosphoinositide binding activity to that of tCNT1a. ACAP2, ACAP3, and GST-tCNT-1a were synthesized and labeled with S35-MET(*) as in A and quantified as described in Materials and Methods. 40 nM of each protein was then added to the membrane strips.
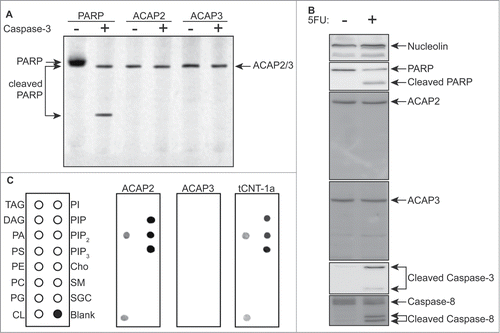
Figure 2. ACAP2 has an identical lipid-binding pattern to that of CNT-1. (A) Neither ACAP2 nor ACAP3 is cleaved by caspase-3 in vitro. PARP, ACAP2 and ACAP3 were synthesized and labeled with S35-Methionine(*) in rabbit reticulocyte lysate, incubated with or without 1 unit of purified caspase-3 for 2 hours, and then resolved by 15% SDS-PAGE. (B) ACAP2 and ACAP3 are not cleaved during apoptosis. HCT116 cells were treated with DMSO or 375 μM 5FU for 24 hours and cell lysates subjected to immunoblotting. ACAP2 and ACAP3 are not cleaved during apoptosis, whereas Caspase-3, Caspase-8, and PARP are. Nucleolin serves as a loading control. (C) ACAP2, but not ACAP3, displays a similar phosphoinositide binding activity to that of tCNT1a. ACAP2, ACAP3, and GST-tCNT-1a were synthesized and labeled with S35-MET(*) as in A and quantified as described in Materials and Methods. 40 nM of each protein was then added to the membrane strips.

Figure 3. Knockdown of human ACAP2 reduces 5FU-induced apoptosis in cancer cells. (A, C) HCT116 cells stably expressing shRNAs targeting ACAP2, ACAP3, or a non-targeting control (Ctrl) were treated with 375 μM 5FU for 24 hours prior to analysis of phosphatidylserine externalization (Annexin V) via flow cytometry. Where indicated, cells were pretreated with 2 μM Z-VAD-FMK for 1 hour. (B) A549 cells stably expressing shRNAs targeting ACAP2 or a non-targeting control (Ctrl) were treated and analyzed as in A. All Data shown represent at least 3 independent experiments +/− SEM. P-values were calculated using Student's t-test (unpaired, 2-tailed). (D) Immunoblots showing degree of ACAP2 and ACAP3 knockdown for 2 independent shRNAs.
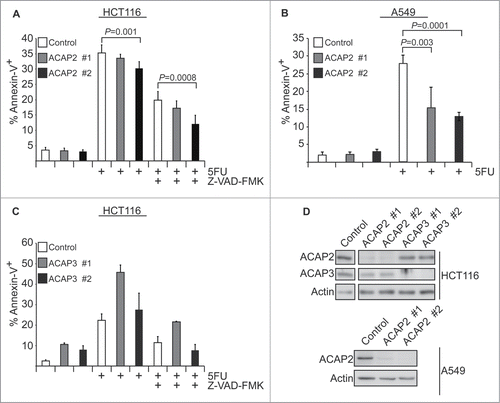
Figure 3. Knockdown of human ACAP2 reduces 5FU-induced apoptosis in cancer cells. (A, C) HCT116 cells stably expressing shRNAs targeting ACAP2, ACAP3, or a non-targeting control (Ctrl) were treated with 375 μM 5FU for 24 hours prior to analysis of phosphatidylserine externalization (Annexin V) via flow cytometry. Where indicated, cells were pretreated with 2 μM Z-VAD-FMK for 1 hour. (B) A549 cells stably expressing shRNAs targeting ACAP2 or a non-targeting control (Ctrl) were treated and analyzed as in A. All Data shown represent at least 3 independent experiments +/− SEM. P-values were calculated using Student's t-test (unpaired, 2-tailed). (D) Immunoblots showing degree of ACAP2 and ACAP3 knockdown for 2 independent shRNAs.

Figure 4. For figure caption, see page 1776.Figure 4 (See previous page) Oncomine analysis of ACAP2 and ACAP3 expression levels in cancer versus normal cells. (Left) A summary of comparisons of ACAP2 and ACAP3 expression levels in different cancer vs. normal tissue datasets. The bottom rows in each case indicate the total number of unique analyses and the number of unique analyses that show significant overexpression (red) or underexpression (blue) of the target gene in the cancer samples relative to the normal tissue samples. Color intensity indicates the percentile rank of genes (key at bottom) displaying significant overexpression or underexpression. (Right) Box and whisker plots of representative studies profiling decreased expression of ACAP2 in esophageal cancer, leukemia and lymphoma. Details include study name, P-value, t-test score and fold change. Tissue or cancer type is indicated below the plots with the number of analyzed samples indicated in parentheses.
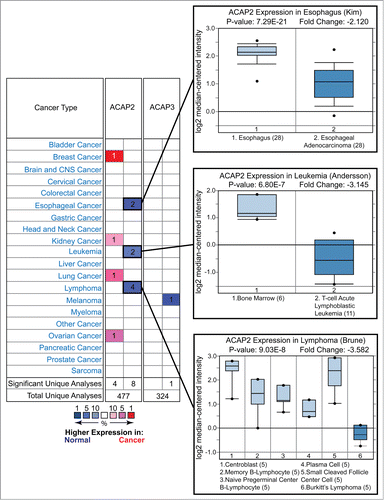
Figure 4. For figure caption, see page 1776.Figure 4 (See previous page) Oncomine analysis of ACAP2 and ACAP3 expression levels in cancer versus normal cells. (Left) A summary of comparisons of ACAP2 and ACAP3 expression levels in different cancer vs. normal tissue datasets. The bottom rows in each case indicate the total number of unique analyses and the number of unique analyses that show significant overexpression (red) or underexpression (blue) of the target gene in the cancer samples relative to the normal tissue samples. Color intensity indicates the percentile rank of genes (key at bottom) displaying significant overexpression or underexpression. (Right) Box and whisker plots of representative studies profiling decreased expression of ACAP2 in esophageal cancer, leukemia and lymphoma. Details include study name, P-value, t-test score and fold change. Tissue or cancer type is indicated below the plots with the number of analyzed samples indicated in parentheses.

Table 2 Mutations in ACAP2 and ACAP3 in COSMIC database. Summary of non-synonymous mutations in ACAP2 and ACAP3 with multiple reports in COSMIC. Columns include mutation in coding sequence, AA (amino acid) Mutation, COSMIC Mutation ID, number of reports in COSMIC and mutation type

Reprints and Corporate Permissions

Please note: Selecting permissions does not provide access to the full text of the article, please see our help page How do I view content?

To request a reprint or corporate permissions for this article, please click on the relevant link below:

Academic Permissions

Please note: Selecting permissions does not provide access to the full text of the article, please see our help page How do I view content?

Obtain permissions instantly via Rightslink by clicking on the button below:

If you are unable to obtain permissions via Rightslink, please complete and submit this Permissions form. For more information, please visit our Permissions help page.