Figures & data
Figure 1. MEF2C protein level is downregulated in mitosis and is targeted for degradation by the Ubiquitin-Proteasome Pathway. (A) MEF2C is expressed in proliferating myoblasts. Total protein extracts from C2 growing myoblasts (Mb) or differentiated myotubes (Mt) were analyzed by Western blot with antibodies against myosin heavy chain (MyHC), MYOGENIN, MYOD and MEF2C. Actin was used as loading control. (B) MEF2C protein level decreases in mitotic cells. C2 cells were grown asynchronously in high serum medium (Asyn), arrested in G0/G1 by incubation in methionine-depleted medium, synchronized in S by treatment with aphidicoline or incubated with Nocodazole before shake off treatment to generate a mitotic fraction (Shake off fraction; M) and a non-mitotic fraction (adherent; G2). Cell lysates obtained from synchronized cell populations were analyzed by Western blot assay with antibody against MEF2C. Antibodies specific for CYCLIN A and histone H3 phosphorylated on Ser10 (pH3(Ser10)) were used to verify the level of synchronization in S and M phases obtained with the treatments. Vinculin was used as loading control. DNA content was assessed by flow cytometry analysis, percentage of distribution in G0/G1, S and G2/M phase are reported (lower panel). (C) Analysis of Mef2C transcripts during the cell cycle. Total RNA was isolated from synchronized populations obtained as in A and Mef2c mRNA level was quantified by RT-qPCR. The ratio between Mef2c and Gapdh transcripts was calculated in each synchronized cell population. Value obtained for asynchronous C2 was arbitrarily set equal to 1. Histograms report the mean of 2 independent experiments ± SEM. * and ** represent P-values ≤ 0.05 and ≤ 0.01 respectively. (D) MEF2C is degraded by the proteasome. C2 proliferating myoblasts were incubated with increasing concentrations of the proteasome inhibitor MG132 (25 μM or 50 μM) from a stock in DMSO, the control sample received an equivalent volume of DMSO. After 4 hours of treatment cells were harvested and protein extracts were analyzed by Western blotting with anti-MEF2C specific antibody. Vinculin was used as a loading control. Lower panel shows the results of the densitometric quantification of the signals obtained with the anti-MEF2C antibody normalized for the total amount of protein. The quantity of MEF2C protein in MG132 treated cells is expressed relative to the quantity of MEF2C in the control sample (DMSO) taken as 1. (E) MEF2C is poly-ubiquitinated in proliferating myoblasts. CoIP and Western blot assays of lysates from C2 cells transiently transfected with vectors coding for FLAG-MEF2C and increasing amounts of HA-ubiquitin (HA-Ub) or Empty Vector (EV) as control. 30 hours after transfection cells were treated with MG132 and then harvested. Anti-FLAG antibody was used for immunoprecipitation (IPαFLAG), anti-FLAG and anti-HA for Western blot detection of total Input and of immunoprecipitated proteins (IPαFLAG). Western blot results shown in B, D and E are representative of 2 independent experiments showing similar profiles.
Figure 2. Ser98 phosphorylation of MEF2C peaks in mitosis, triggers poly-ubiquitination of the protein and reduces its stability. (A) Schematic of the MEF2C isoforms in the exon 3 region, with the location of the primers used to detect the alternate α1 and α2 exons indicated (arrows). The amminoacid sequences of the α exons of the mouse protein are indicated below. The positioning of Ser98 and Ser110 phosphoacceptor sites in α1 exon (and the residue equivalent to Ser98 in α2 exon) are highlighted in red. (B) Exclusive inclusion of the α1 exon in Mef2c transcripts in growing myoblasts. Total RNA was isolated from C2 myoblasts (Mb) or C2 cells that were differentiated for various lengths of time (0–72h). Exon expression was detected by RT-PCR using common primer (indicated in A) located on exons 2 and 4 that give rise to amplification products with different electrophoretyc mobility. Amplification of plasmid vectors containing the murine cDNAs of the MEF2C α1 and α2 splice variants were used as controls of the correct size of expected amplicons (α1 and α2 sample lanes). Rplp0 was used as endogenous control. (C). MEF2C is highly phosphorylated on Ser98 in mitotic cells. Cell lysates of asynchronous (Asyn) or synchronized cells were analyzed by Western blot with polyclonal antibodies that recognize the phosphorylated Serine 98 (pSer98) or Serine 110 (pSer110) of MEF2C. Vinculin was used as loading control. The levels of Ser98 and Ser110 phosphorylation, evaluated by densitometric scanning, were normalized to the quantity of MEF2C protein (see ). In the histogram below are reported the phosphorylation grades of the 2 residues in synchronized cells, expressed relative to the value obtained in asynchronous cells, taken as 1. (D). Ser98 and Ser110 phosphorylation triggers MEF2C poly-ubiquitination. C2 myoblasts were transiently transfected with expression vectors for HA-ubiquitin and FLAG-tagged wild type (WT) or not phosphorylable MEF2C 2SA mutant where Ser98 and Ser110 are substituted with alanines. Anti-FLAG antibody was used for immunoprecipitation (IPαFLAG), anti-HA for Western immunoblot detection (IB). (E) The non-phosphorylable MEF2C mutant proteins on Ser98 and Ser110 are more stable than the wild type protein. FLAG MEF2C wild type or mutated singularly on Ser98 (S98A), Ser110 (S110A) or both phosphoacceptor sites (2SA) were overexpressed in COS1 cells. After 36 h, protein synthesis was blocked with cycloheximide, the amount of FLAG MEF2C remaining at different times was checked by Western blot. Protein loading was controlled by anti- vinculin staining. The intensity of FLAG signal was quantified by densitometric analysis. The graph reports average of the intensity of MEF2C signals, relatively to the not treated sample (CHX 0h), of 2 independent experiments. Bars represent SEM. Western blot results reported in C and D are representative of 2 independent experiments that showed similar profiles.
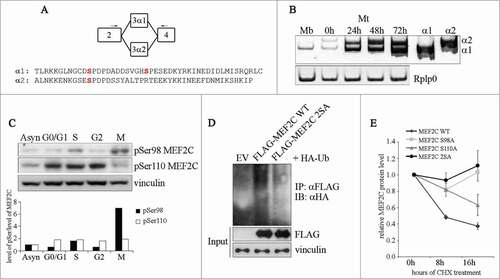
Figure 3. MEF2C protein level is controlled by CDC20 or CDH1, depending on the phosphorylation of Ser98 and Ser110. (A). MEF2C physically interacts with CDC20 and CDH1. Co-immunoprecipitation analysis of HEK293T cells transiently transfected with empty vector (EV) or HA-tagged vectors coding for CDC20 and CDH1 along with FLAG-MEF2C WT or 2SA. 48 hours after transfection, cells were treated with MG132 and harvested. Total protein extracts (Input) were incubated with protein A beads conjugated with anti-HA antibody. Left: input. Right: immunoprecipitated proteins. FLAG-tagged MEF2C was detected by Western blotting with anti-FLAG antibody. Vinculin was used as a loading control. Asterisk (*) indicates non-specific bands. (B) MEF2C expression is reduced by CDC20 and CDH1 overexpression, CDC20 dependent degradation relies on pSer98/pSer110 phosphorylation. C2 proliferating myoblasts were co-transfected with an empty vector (EV) or HA-tagged CDC20 and CDH1 vectors along with phosphorylable (WT) or not-phosphorylable (2SA) MEF2C. Cell extracts were analyzed by Western blotting with antibodies against FLAG and HA. Vinculin was used as loading control. The histogram (right panel) reports the densitometric quantification of MEF2C protein level (FLAG signal) normalized to the total amount of protein expressed relatively to the quantity of protein in the control sample, taken as 1. Histograms show means ± SEM of 3 independent experiments. ** represent P-values ≤ 0.01. (C) RNAi knockdown of Cdc20 and/or Cdh1 results in an accumulation of MEF2C. Asynchronous C2 cells were transfected with a control siRNA (siCTRL) or a pool of siRNAs targeting Cdh1 (siCdh1, left panel) or Cdc20 (siCdc20, middle panel) mRNAs and analyzed 72 hours later. Alternatively C2 cells transfected with siCdc20 were treated over-night with Nocodazole after 36 hours from transfection (left panel). Protein extracts were analyzed by Western blotting with antibody against MEF2C, CDH1, CDC20 and histone H3 phosphorylated on Ser10, a marker of the M phase. Vinculin was used as loading control. The results of the Western blot shown in A and C are representative of 2 independent experiments that gave similar profiles.
Figure 4. Ser98/Ser110 phosphorylation and a proximal conserved D-box are required for CDC20-dependent degradation of MEF2C. (A) Amminoacid sequence encoded by the α1 isoform. Sequence of a putative D-box near the Ser98 and Ser110 phosphoacceptor sites. Alignment with ClustalW of the amminoacid sequences encompassing the phosphorylable residues of MEF2C proteins from different species revealed the presence of a conservd D-box. Amminoacids forming the putative destruction box (D-box) are highlighted in blue, Ser98 and Ser110 in red. The deletion introduced in the MEF2C D-box mutant (MEF2C D-box del) is indicated. (B) The D-box and Ser98/Ser110 phosphorylation are all necessary for MEF2C degradation. C2 proliferating myoblasts were co-transfected with an empty vector (EV) or HA-tagged CDC20 and CDH1 vectors along with, alternatively the wild type MEF2C protein (WT), the D-box deleted mutant (WT D-box DEL), the not-phosphorylable MEF2C 2SA mutant or the MEF2C 2SA mutant deleted of the D-box (2SA D-box DEL). Cell extracts were analyzed by Western blotting with antibodies against FLAG and HA. Vinculin was used as loading control.
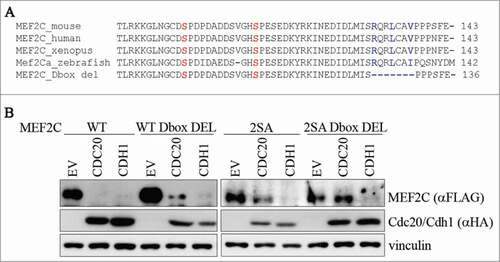
Figure 5. The ectopic expression of a stable, non phosphorylable mutant of MEF2C can delay cell cycle progression. (A) Overexpression of the MEF2C 2SA mutant is linked to a reduced number of mitotic events. COS-1 cells were transfected with vectors coding for wild type MEF2C (WT) or the not-phosphorylable FLAG-MEF2C 2SA mutant. 48 hours later cells were fixed for immunofluorescence analysis and stained with antibodies for phosphorylated histone H3 and FLAG. Transfected cells were scored for the frequency of mitosis. Histograms show means ± SEM of 2 independent experiments. ** represent P-values ≤ 0.01. (B) MEF2C 2SA impairs nuclear translocation of CYCLIN B1. HT29 cells transiently transfected with an empty vector (EV) or the expression vectors for the wild type or the not-phosphorylable MEF2C 2SA mutant were lysed in order to obtain nuclear and cytoplasmic protein extracts. The different fractions were analyzed by Western blotting with CYCLIN B1 antibody. Histone H3 and Vinculin antibodies were used as loading control respectively for nuclear and cytoplasmic fraction. (C) MEF2C regulates the expression of genes encoding inhibitors of the G2/(M) transition. Left panel, Total RNA was isolated from transfected C2 cells overespressing the wild type or 2SA MEF2C protein. The transcripts of Gadd45b, P21 and 14.3.3 γ genes were amplified by RT-PCR, PCR products were separated in 8% polyacrylamide gels. Rplp0 was used as endogenous control. The histograms in the right panel report the results of the densitometric quantification of the bands normalized to Rplp0 and expressed relatively to the empty vector transfected cells taken as 1. The RT-PCR results are representative of 2 independent experiments. (D) MEF2C is differentially expressed in CRC cell lines. Total protein extracts from HCT116 and HT29 proliferating cells were analyzed by Western blot with antibody against MEF2C. Vinculin was used as loading control. (E) MEF2C modulates cell cycle progression in a phosphorylation-dependent manner. HT29 cells were transfected with an empty vector (EV) or vectors coding for the wild type MEF2C protein or the non-phosphorylable MEF2C 2SA. After 24 hours, 0.1 × 10⁶ cells were plated for each sample. Cells were then harvested every 24 hours and the number of proliferating cells were counted with an hemacytometer after Trypan blue staining. The graphs show means ± SEM of 4 independent experiments. Statistical significance of variation between values obtained at each time points with MEF2C 2SA and MEF2C WT was calculated. Differences between 2SA and WT are statistically significant. ** and *** represent P-values ≤ 0.01 and ≤ 0.001 respectively. (F) RNAi knockdown of Mef2c impairs HCT116 proliferation rate. HCT116 cells were transfected with a control siRNA (siCTRL) or a pool of siRNAs targeting Mef2c (siMef2c) and proliferation rate was evaluated as described in E. The graphs show means ± SEM of 4 independent experiments. ** and *** represent P-values ≤ 0.01 and ≤ 0.001 respectively.