Figures & data
Figure 1. The expression of EP receptors in mouse primary myoblast. The qPCR results showed that all 4 EP receptors are detectable in mouse primary myoblast, with the Ct values of 25.0 (EP1), 29.6 (EP2), 26.4 (EP3), and 22.2 (EP4).
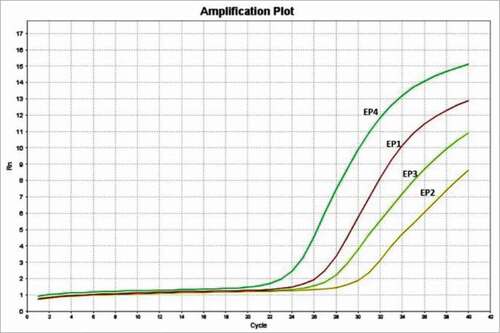
Figure 2. PGE2 signaling through EP4 receptor increases mouse primary myoblast proliferation. A, No significant change was observed after treatment with PGE2, 17-PT PGE2 (EP1/EP3 agonist), butaprost (EP2 agonist), or CAY 10598 (EP4 agonist) for 24h; B, PGE2 and EP4 agonist CAY 10598 significantly promoted primary myoblast proliferation at 48 h; C, EP4 antagonist L161,982 inhibited primary myoblast proliferation dose-dependently at 24 and 48 h; D, Cotreatment with L161,982 blocked the effect of PGE2 and CAY 10598 on primary myoblast proliferation at 48 h. N = 4–5, *: P < 0.05. E, Representative images of MyoD staining for a: Control; b: PGE2; c: 17-PT PGE2; d: Butaprost; e: CAY 10598; f: L161,982; g: L161,982+PGE2; h: L161,982+CAY 10598.
Figure 2. (Continued)
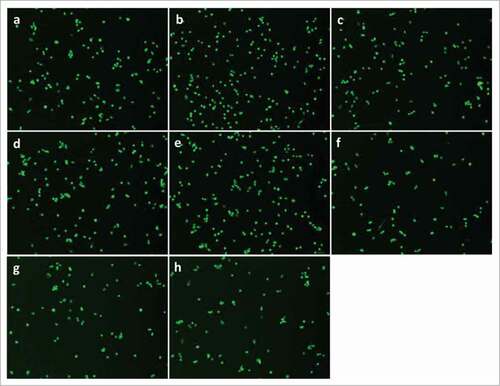
Figure 3. PGE2/EP4 signaling is important for G1-S phase cell cycle transition in primary myoblasts. Representative cell cycle profile at 24 h (A) and 36 h (B), with respective quantification of cell distribution in cell cycle. N = 3, *: P < 0.05 compared with control; #: P < 0.05 compared with L161,982.
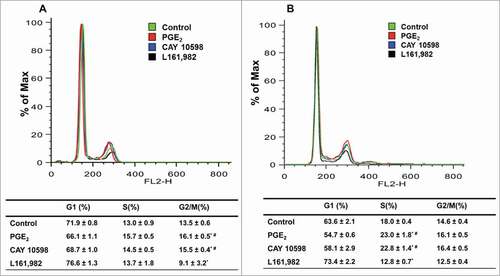
Figure 4. (A) Real-time gene expression of regulators of G1-S phase transition in cell cycle. After treatment for 36 h, PGE2 and CAY 10598 upregulated cyclin E1 expression, but downregulated myostatin and p21Cip1 expressions. In contrast L161,982 increased p21Cip1 and myostatin expression, but inhibited cyclin E1 expression. These results support our finding in cell cycle analysis. N = 5, *: P < 0.05. (B) Representative Western blot from 2 replicate experiments illustrating that p21Cip1 protein content increased after L161,982 treatment. Bands from left to right: Control, PGE2, CAY 10598, and L161,982.
Figure 5. Mouse PathwayFinder PCR Gene Array results demonstrate that the gene expression of antioxidant enzymes Hmox1 and Nqo1 were significantly upregulated after treatment with L161,982.
Figure 6. ROS production after treatment with PGE2, CAY 10598, or L161,982. Gray solid area: Control; Blue curve: treatment. (A) ROS production after treatment for 12 h. a: PGE2; b: CAY 10598; c: L161,982. (B) quantification of ROS production in A. (C) ROS production after treatment for 36 h. a: PGE2; b: CAY 10598; c: L161,982. (D) quantification of ROS production in C. N = 3, *: P < 0.05. (E) Representative Western blot from 3 repetitions illustrating that MyoD protein content decreased after L161,982 treatment. Bands from left to right: Control, PGE2, CAY 10598, and L161,982.
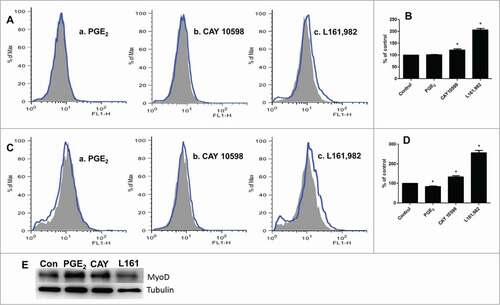
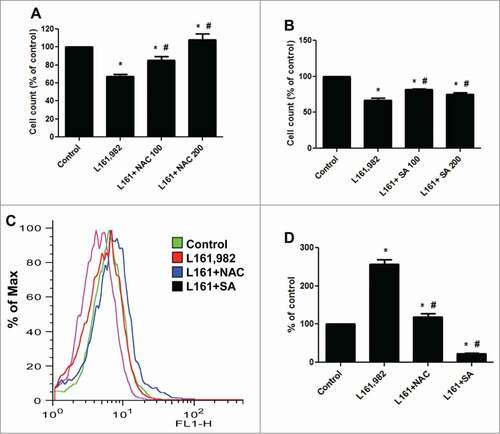
Figure 7. Cotreatment with antioxidants NAC and SA reversed the effect of L161,982 on myoblast proliferation and ROS production. (A and B) Cotreatment with NAC (A) or SA (B) successfully reversed the inhibition of myoblast proliferation caused by L161,982; (C) cotreatment with NAC and SA inhibited the overproduction of ROS induced by L161,982. (D) quantification of ROS production in C. N = 3, *: P < 0.05 compared with control; #: P < 0.05 compared with L161,982.