Figures & data
Figure 1. DNA-PKcs plays a role in primary tumor formation. The downregulation of DNA-PKcs protein levels in cells and tumors (volume of 1500 mm3) after infection with lentiviral particles carrying a shRNA directed against DNA-PKcs (shDNA-PK) or a nontargeting shRNA (shCTL) was checked by (A) protein gel blotting with an antibody against DNA-PKcs (β-actin was used as an internal control) and by (B) immunostaining for DNA-PKcs (green). DNA was stained with DAPI (blue). Scale bar = 20 μm. (C) Proliferation of SK28 cells stably transduced with shCTL and shDNA-PK. Results are expressed as mean cell number ± standard error of mean (SEM) for 2 independent experiments. (D) The percentage of mice displaying primary tumor formation 21 d after the injection of different number of cells transduced with shDNA-PK and shCTL (n ≤ 6 mice/each injection condition). (E) Growth of primary tumors from cells transduced with shCTL and shDNA-PK, after the injection of 4 × 10⁶ cells into Nude mice. (F) Comparison of angiogenesis in shCTL and shDNA-PK tumors of different sizes. Results show the mean number of vessels stained with anti-CD31 antibodies ± SEM per microscopic field for each group (shCTL, n=3 ; shDNA-PK, nequals;4 ). (G) Comparison of proliferation index at different tumor sizes, for shCTL and shDNA-PK tumors. Results are expressed as the mean percentage of proliferative cells stained with anti-Ki67 antibodies ± SEM per microscopic field, for each group (shCTL, nequals;3; shDNA-PK, nequals;4 ). The significance of differences was assessed in Mann-Whitney tests. *P < 0.05, **P < 0.005.
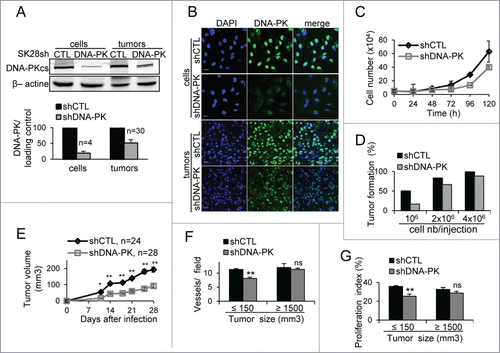
Figure 2. DNA-PKcs depletion impairs the formation of melanoma metastases. We grafted 4×10⁶ cells of shCTL- and shDNA-PK-treated SK28 cells into Nude mice and then surgically removed the resulting primary tumors when they attained a volume of 1500 mm3. Animals were monitored for 258 d after grafting, to check for the occurrence of metastases in the proximal lymph node. (A) Lymph-node metastasis-free survival curves for shCTL and shDNA-PK tumors (*P=0 .018, Kaplan-Meier test). (B) Representative images of double-immunostaining for DNA-PK (green) and human melanoma marker S-100 (red) in shCTL and shDNA-PK metastases. Yellow arrows indicate infiltrating mouse cells, white arrowheads indicate human DNA-PK-positive cells and green arrowheads indicate human DNA-PK-deficient cells. DNA was stained with DAPI (blue). Scale bar = 20 μm.
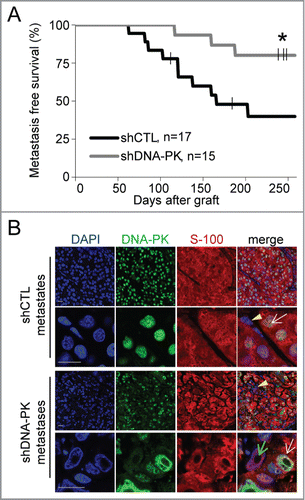
Figure 3. The depletion or inhibition of DNA-PKcs impairs cell migration. Cell migration was measured in a Transwell assay (A–C) and in a wound healing assay (D, E), in cells depleted of DNA-PKcs by siDNA-PK (MRC-5) or shDNA-PK (SK28 and OCM-1) or after the inhibition of DNA-PKcs with a specific inhibitor (10 μM NU7026). Wound healing was assessed in DNA-PK-deficient V3 rodent cells complemented with wild-type DNA-PK (F18 cells) or the kinase-dead DNA-PKcs mutant (KA4 cells). (A) Representative image of shCTL-treated and shDNA-PK-treated migratory cells, fixed on the bottom of a Transwell filter. (B) The percentage cell migration was calculated from the number of cells migrating to the bottom of the filter and was normalized with respect to the corresponding control. The values shown are the means of at least 3 independent experiments (each conducted in duplicate) for each set of experimental conditions. (C) Dose effect of the inhibitor, NU7026, on the migration of MRC-5 and SK28 cell lines. (D) Example of wound healing microscopy measurements in the various conditions. (E) Percentage wound closure, estimated as the difference in cell-free surface area between the images obtained at 0 h and 16 h (24 h for OCM-1 cells) in the various conditions (n=2 independent experiments per set of conditions). The significance of differences was assessed in Mann-Whitney tests. *P < 0.05, **P < 0.005.
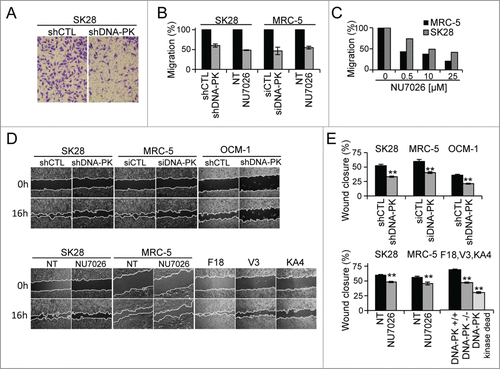
Figure 4. The depletion or inhibition of DNA-PKcs impairs melanoma cell invasion. Matrigel invasion by SK28 human melanoma cells (A) transformed with shCTL or shDNA-PK, or (B) incubated in the presence of DNA-PK inhibitor (10 μM NU7026). The graphs show the mean percentage invasion ± SEM for each set of conditions, normalized with respect to control conditions (n=3 , each experiment conducted in duplicate or triplicate). Representative fields from the bottom of the filter are shown and the percentage invasive cells is shown on the right. (C) Inhibition of SK28 spheroid invasion after DNA-PKcs-depletion. Spheroids from shCTL-treated or shDNA-PK-treated SK28 cells were embedded into collagen I for 3-dimensional invasion assays. Representative images of SK28 spheroid invasion obtained just after embedding in collagen (0 days), and 2 and 4 d after embedding, from left to right. Scale bar: 20 μm. The graph shows the mean invasion area ± SEM (shCTL, n= 5 and shDNA-PK, n=6 ), as measured by time-lapse microscopy and calculated with ImageJ software. The significance of differences was assessed in Mann-Whitney tests. *P < 0.05, **P < 0.005.
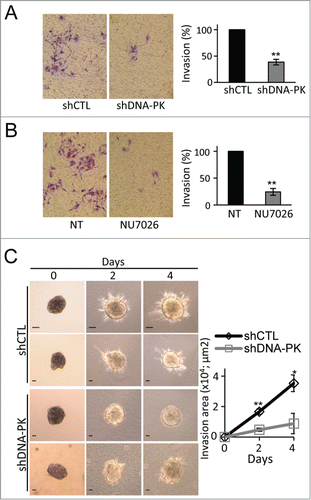
Figure 5. Inhibition of melanoma cell migration and invasion by conditioned media (CM) from DNA-PKcs-deficient melanoma cells. (A) Cell migration, assessed in a Transwell assay of SK28shCTL and SK28shDNA-PK cells with or without fold4- concentrated CM from either SK28shCTL or SK28shDNA-PK cells. Representative images of migratory cells in the indicated conditions are shown. The mean percentage migration ± SEM for each set of conditions, normalized with respect to control conditions (n=3 , each conducted in duplicate) is next to the images. (B) Cell invasion, assessed by Matrigel Transwell assays of SK28shCTL and SK28shDNA-PK cells with and without fold4- concentrated CM from either SK28shCTL or SK28shDNA-PK cells. Representative images of invasive cells in the indicated conditions are shown. The mean percentage invasion ± SEM for each set of conditions, normalized with respect to control conditions (n=3 , each conducted in duplicate) is shown below the images. The significance of differences was determined in Mann-Whitney tests. *P < 0.05, **P < 0.005.
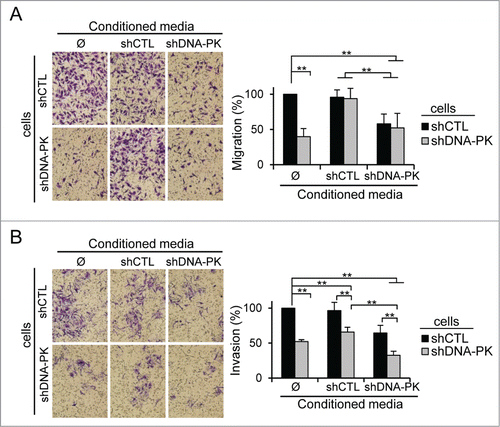
Figure 6 (See previous page). SILAC + LC-MS/MS secretome analysis showing the DNA-PKcs-dependent regulation of MMPs and other metastasis-associated proteins. (A) The SILAC ratio (shDNA-PK/shCTL) is shown for proteins from the "Inhibition of Matrix Metalloproteases" pathway: α-2M, MMP-8, HSPG-2, TIMP-2, MMP-14 and MMP-1 and metastasis-associated protein FBLN-1. No difference in HSP70 secretion was observed between SK28shCTL and SK28shDNA-PK cells, so this protein was used as a control. Criteria for a significant change: fold change ≥ 1.5; P ≤ 0.05; peptides used for quantification ≥ 3. (B, C) The differential secretion of proteins was confirmed by western blotting. Conditioned media (CM) from SK28shCTL and SK28shDNA-PK cells was normalized according to the number of cells in the culture from which they were prepared. CM concentrated by a factor of 50 was denatured and FBLN-1, α-2M, MMP-8, TIMP-2, MMP-14 and MMP-1 were detected by immunoblotting. HSP70 served as a loading control. (D) DNA-PKcs silencing increases the expression of FBLN-1 and α-2M but does not change expression of MMP-8, HSPG2, TIMP-2, MMP-14 and MMP-1. The bar graph shows the microarray results as a relative fold-change for secreted proteins of interest after DNA-PKcs silencing in SK28 melanoma cells. Negative values indicate repression. Values highlighted in light gray are significant (FBLN-1, α-2M). Statistical significance: fold-change ≥ 1.5 and P < 0.05. (E) Comparison of the proteome and secretome after the DNA-PKcs-depletion in SK28 cells. The Venn diagrams show the overlap between proteins (with numbers indicated) from the proteome and secretome. A–Proteins differentially secreted and not present in the proteome (n=67 ); B–Proteins differentially secreted but not differentially present in the proteome (n=24 ); C–Proteins both differentially secreted and differentially present in the proteome (n=12 ); D–Proteins differentially present in the proteome, but not differentially secreted (n=14 ); E- Proteins differentially present in the proteome and not detected in the secretome (n=93 ). (F) Quantification of secreted proteins abundance from SK28 cells treatment with siCTL and siDNA-PKcs or DMSO and DNA-PKcs inhibitor (NU7026, 10μM). CM concentrated by a factor of 50 (siCTL, siDNA-PK) or 25 (DMSO, NU7026) was denatured and FBLN-1, α-2M, TIMP-2 and HSP70 were detected by immunoblotting (not shown). The bar charts give the average abundance of indicated proteins normalized to the loading control (HSP70).
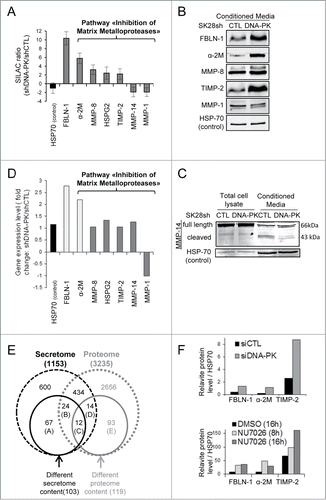
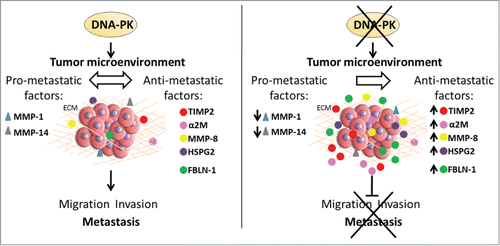
Figure 7. Model of the role of DNA-PKcs in regulating the tumor microenvironment. In the presence of DNA-PKcs, tumor cells maintain the balance between pro- and anti-metastatic secreted factors (left). In the absence of DNA-PKcs, this balance is modified. DNA-PKcs knockdown leads to the secretion of anti-metastatic factors, such as TIMP-2, α-2M, MMP-8, HSPG2 and FBLN-1, and to downregulation of the secretion of pro-metastatic factors, such as MMP-1 and MMP-14 (right). The absence of DNA-PKcs therefore inhibits cell migration and invasion, thereby preventing tumor metastasis.