Figures & data
Figure 1. UVB irradiation and time-lapse FUCCI imaging of cell-cycle progression. HeLa-FUCCI cells were cultured in 35 mm dishes for 24 h. The cells were irradiated with 100 or 200 J/m2 UVB using a Benchtop 3UV transilluminator (UVP, LLC, Upland, CA) with an emission peak at 302 nm. After irradiation, cell-cycle progression, as well as mitotsis and apoptosis were observed every 30 min for 72 h by FV1000 confocal microscopy (Olympus). The UVB dose was measured with a UVX Radiometer (UVP). After UVB irradiation, cell-cycle progression and apoptosis were observed every 30 min for 72 h using the FV1000. Scanning and image acquisition were controlled by FluoView software (Olympus).
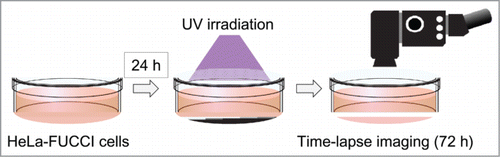
Figure 2. Single-cell time-lapse imaging in HeLa-FUCCI cells after irradiation with 100 J/m2 UVB. (A) Individualization of cancer cells. Each cell was individualized by numbering. The cell-cycle phase of each cell was observed every 30 min for 72 hours by confocal imaging. (B) Time-lapse imaging of the cell-cycle and apoptosis after irradiation with 100 J/m2 UVB. (C) Apoptosis after irradiation with 100 J/m2 UVB. The cells circled with white dotted lines entered apoptosis after mitosis. (D) Distribution of cell-cycle phase after irradiation with 100 J/m2 UVB.
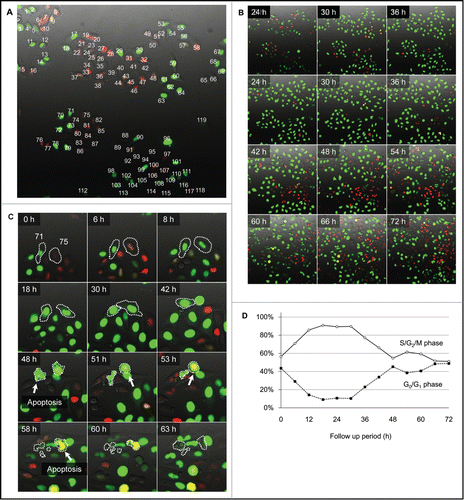
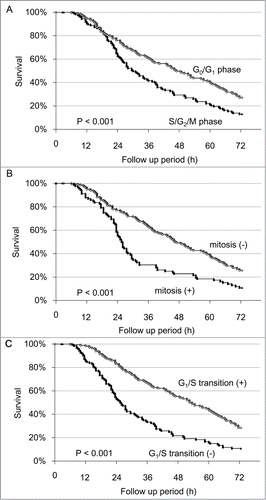
Figure 3. Survival analysis of individual cells after irradiation with 100 J/m2 UVB. (A) Kaplan-Meier survival curve for G0/G1 phase cells and S/G2/M phase cells at the onset of UVB irradiation. (B) Kaplan-Meier survival curve for the cells entering mitosis within 24 h after UVB irradiation compared to non-mitotic cells. (C) Kaplan-Meier survival curve for the cells which transitioned from G1 phase to S phase within 24 h after UVB irradiation, compared with cells without G1/S transition.
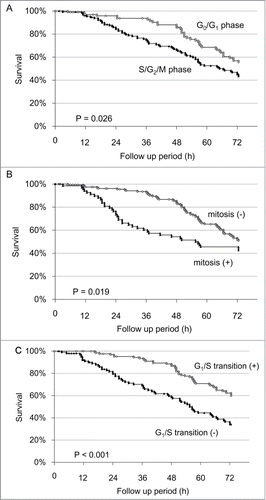
Table 1. Time-lapse cell-cycle imaging of individual HeLa-FUCCI cells after UVB irradiation
Figure 4. Single cell time-lapse imaging of HeLa-FUCCI cells after irradiation with 200 J/m2 UVB. (A) Individualization of cancer cells. Each cell was individualized by numbering. The cell-cycle phase of each cell was observed every 30 min for 72 hours by confocal microscopy imaging. (B) Time-lapse imaging of the cell-cycle phase and apoptosis after irradiation with 200 J/m2 UVB. (C) Apoptosis after irradiation with 200 J/m2 UVB. Cell 96 entered apoptosis after mitosis. Cell 97 cell became apoptotic without mitosis. (D) Distribution of cell-cycle phase after irradiation with 200 J/m2 UVB.
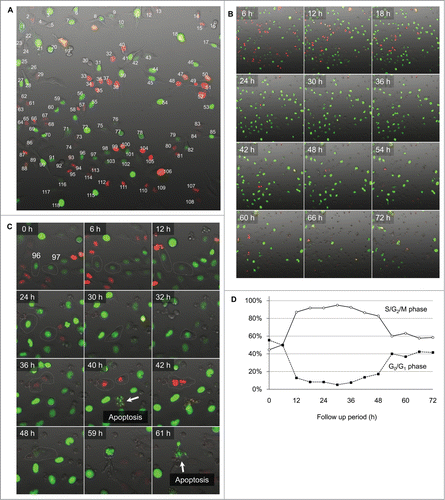
Figure 5. Survival analysis of individual cells after irradiation with 200 J/m2 UVB. (A) Kaplan-Meier survival curve for G0/G1 and S/G2/M cells at the onset of UVB irradiation. (B) Kaplan-Meier survival curve for cells which entered mitosis within 24 h after irradiation with UVB compared to non-mitotic cells. (C) Kaplan-Meier survival curve for the cells which transitioned from G1 to S phase within 24 h after irradiation with UVB, compared to cells without G1/S transition.