734
Views
4
CrossRef citations to date
0
Altmetric
Report

Cell cycle specific distribution of killin: evidence for negative regulation of both DNA and RNA synthesis

, , , , &
Pages 1823-1829 | Received 26 Jan 2015, Accepted 02 Apr 2015, Published online: 17 Jun 2015

Figures & data

Figure 1. RFP-Killin and DNA replication accessory proteins exhibit mutually exclusive nuclear expression pattern during S-phase. (A) S-phase co-localization of RFP-Killin with RPA. The RFP-Killin in-frame fusion protein or RFP control expression vectors were transiently transfected into Cos-E5 cells. Twenty-four hours after the transfection, S phase cells undergoing DNA replication were visualized by punctate staining with anti-RPA70, followed by secondary Alexa Flour488 goat anti-Rabbit IgG (green). Representative images of the co-localization of RPA and RFP-Killin in the nucleus viewed by confocal microscopy. The two proteins showed a mutually exclusive pattern (merge), in contrast to RPA vs RFP control. The scale bar was at 4.93 μm. (B) S-phase co-localization of RFP-Killin with GFP-PCNA. The RFP-Killin or RFP expression vectors were transiently co-transfected with GFP-PCNA into Cos-E5 cells. The S-phase cells undergoing DNA replication as marked by punctate nuclear GFP-PCNA staining were visualized by confocal microscopy. Representative images of the co-localization of GFP-PCNA and RFP-Killin in the nucleus showed a mutually exclusive pattern (merge), in contrast to RFP control. The scale bar was at 4.09 μm.
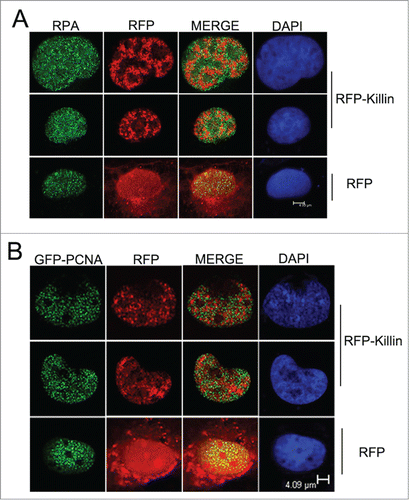
Figure 1. RFP-Killin and DNA replication accessory proteins exhibit mutually exclusive nuclear expression pattern during S-phase. (A) S-phase co-localization of RFP-Killin with RPA. The RFP-Killin in-frame fusion protein or RFP control expression vectors were transiently transfected into Cos-E5 cells. Twenty-four hours after the transfection, S phase cells undergoing DNA replication were visualized by punctate staining with anti-RPA70, followed by secondary Alexa Flour488 goat anti-Rabbit IgG (green). Representative images of the co-localization of RPA and RFP-Killin in the nucleus viewed by confocal microscopy. The two proteins showed a mutually exclusive pattern (merge), in contrast to RPA vs RFP control. The scale bar was at 4.93 μm. (B) S-phase co-localization of RFP-Killin with GFP-PCNA. The RFP-Killin or RFP expression vectors were transiently co-transfected with GFP-PCNA into Cos-E5 cells. The S-phase cells undergoing DNA replication as marked by punctate nuclear GFP-PCNA staining were visualized by confocal microscopy. Representative images of the co-localization of GFP-PCNA and RFP-Killin in the nucleus showed a mutually exclusive pattern (merge), in contrast to RFP control. The scale bar was at 4.09 μm.

Figure 2. Co-localization of GFP-PCNA with endogenous RPA during S-phase. The GFP-PCNA expression vectors were transiently transfected into Cos-E5 cells. Twenty-four hours after transfection, cells were immune-stained with anti-RPA70 and visualized with Alexa Flour594 Goat Anti-Rabbit IgG (red) and GFP-PCNA (green) by confocal fluorescent microscopy. Co-localization of the 2 proteins (merge) showed largely overlapping signals as yellow colored replication foci. The scale bar was at 4.09 μm.
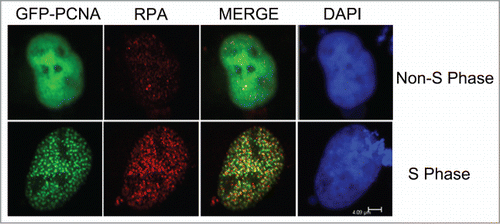
Figure 2. Co-localization of GFP-PCNA with endogenous RPA during S-phase. The GFP-PCNA expression vectors were transiently transfected into Cos-E5 cells. Twenty-four hours after transfection, cells were immune-stained with anti-RPA70 and visualized with Alexa Flour594 Goat Anti-Rabbit IgG (red) and GFP-PCNA (green) by confocal fluorescent microscopy. Co-localization of the 2 proteins (merge) showed largely overlapping signals as yellow colored replication foci. The scale bar was at 4.09 μm.

Figure 3. GFP-Killin is tightly associated with DNA during S-phase. The RFP-Killin or RFP expression vectors were transiently co-transfected with GFP-PCNA into Cos-E5 cells. Twenty-four hours after transfection, the cells were treated with 300 mM NaCl (in situ salt extractions) to remove proteins that were not bound to DNA. Images were acquired in confocal fluorescent microscopy. GFP-PCNA and RFP-Killin showed a mutually exclusive localization pattern of S phase nuclei (merge) that were salt stable, whereas RFP were completely removed by salt extraction. The scale bar was at 4.08 μm.
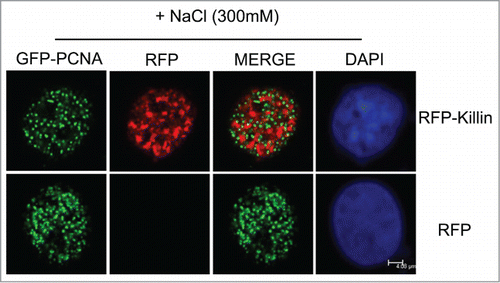
Figure 3. GFP-Killin is tightly associated with DNA during S-phase. The RFP-Killin or RFP expression vectors were transiently co-transfected with GFP-PCNA into Cos-E5 cells. Twenty-four hours after transfection, the cells were treated with 300 mM NaCl (in situ salt extractions) to remove proteins that were not bound to DNA. Images were acquired in confocal fluorescent microscopy. GFP-PCNA and RFP-Killin showed a mutually exclusive localization pattern of S phase nuclei (merge) that were salt stable, whereas RFP were completely removed by salt extraction. The scale bar was at 4.08 μm.

Figure 4. RFP-Killin is localized in cell nucleoli in non-Sphase cells. (A) The RFP-Killin or RFP expression vectors were transiently co-transfected with GFP-PCNA into Cos-E5 cells for 24 h. Non-S-phase cells marked by diffusive GFP-PCNA nuclear staining were visualized via confocal fluorescent microscopy. Note that RFP-Killin resided in the nucleoli. The scale bar was at 4.09 μm. (B) The RFP-Killin and GFP-PCNA expression vectors were transiently co-transfected into Cos-E5 cells and, treated with 300 mM NaCl (in situ salt extractions) prior to immunostaining. Representative images of RFP-Killin in the nucleoli were acquired by confocal fluorescent microscopy. Note that none of RFP-Killin positive nucleoli showed any GFP-PCNA signals. The scale bar was at 2.16 μm.
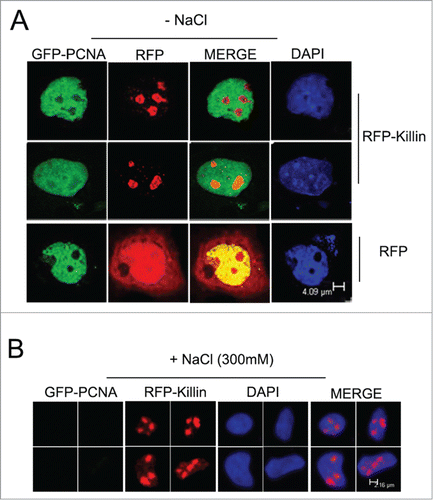
Figure 4. RFP-Killin is localized in cell nucleoli in non-Sphase cells. (A) The RFP-Killin or RFP expression vectors were transiently co-transfected with GFP-PCNA into Cos-E5 cells for 24 h. Non-S-phase cells marked by diffusive GFP-PCNA nuclear staining were visualized via confocal fluorescent microscopy. Note that RFP-Killin resided in the nucleoli. The scale bar was at 4.09 μm. (B) The RFP-Killin and GFP-PCNA expression vectors were transiently co-transfected into Cos-E5 cells and, treated with 300 mM NaCl (in situ salt extractions) prior to immunostaining. Representative images of RFP-Killin in the nucleoli were acquired by confocal fluorescent microscopy. Note that none of RFP-Killin positive nucleoli showed any GFP-PCNA signals. The scale bar was at 2.16 μm.

Figure 5. RFP-Killin is tightly associated with DNA throughout the cell cycle. (A) Cos-E5 cells were transfected with RFP or GFP-PCNA and RFP-Killin expression vectors. Changes in the number of fluorescent positive cells without or with 300 mM NaCl extraction were visualized by fluorescence microscopy (X20). The scale bar was at 0.3 cm. (B) Quantification of fluorescence positive cells before and after salt extraction.
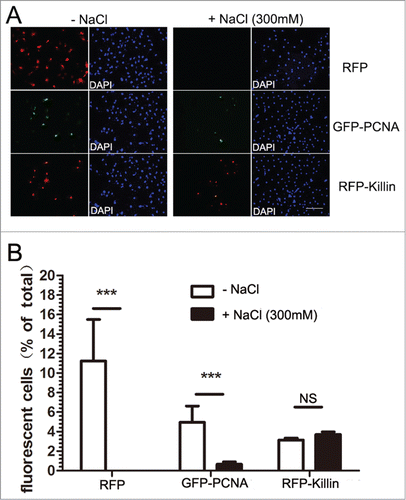
Figure 5. RFP-Killin is tightly associated with DNA throughout the cell cycle. (A) Cos-E5 cells were transfected with RFP or GFP-PCNA and RFP-Killin expression vectors. Changes in the number of fluorescent positive cells without or with 300 mM NaCl extraction were visualized by fluorescence microscopy (X20). The scale bar was at 0.3 cm. (B) Quantification of fluorescence positive cells before and after salt extraction.

Reprints and Corporate Permissions

Please note: Selecting permissions does not provide access to the full text of the article, please see our help page How do I view content?

To request a reprint or corporate permissions for this article, please click on the relevant link below:

Academic Permissions

Please note: Selecting permissions does not provide access to the full text of the article, please see our help page How do I view content?

Obtain permissions instantly via Rightslink by clicking on the button below:

If you are unable to obtain permissions via Rightslink, please complete and submit this Permissions form. For more information, please visit our Permissions help page.