
Figures & data
Figure 1. A strong proliferation potential of breast CAFs. (A) Growth curves of the paired immortalized NFs and CAFs were performed with MTT assay at designed time points. (*, P < 0.05). (B) Phase contrast photomicrographs of NFs and CAFs after incubation for 3 d (upper panel) and 4 d (lower panel). Scale bars, 50 μm. (C) The cell ratio in S-phase was analyzed using the flow cytometry. (*, P < 0.05). (D) The dysregulated expression of ATM and cell cycle regulating genes was re-proved in 3 pairs of primary NFs and CAFs from breast cancer patients by qRT-PCR. (*, P < 0.05). (E) The levels of p-RB, cyclin D1, and c-Myc were determined by Western blot. (*, P < 0.05).
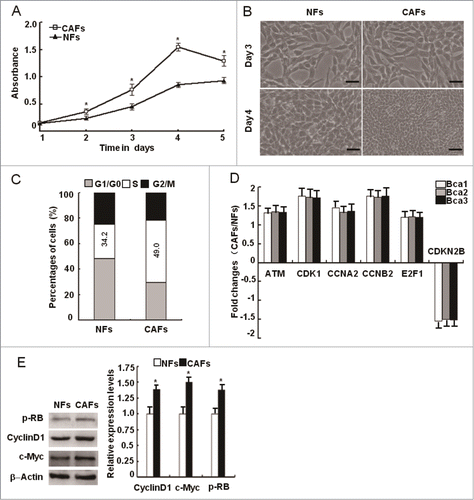
Figure 2. The activation of oxidized ATM independent of DSBs in CAFs. (A) The mRNA expression of the ATM gene was re-proved by qRT-PCR in CAFs and NFs derived from 3 breast cancer patients, and its relative fold changes in CAFs and NFs were presented. (*, P < 0.05). (B, C) The protein levels of total ATM, p-ATM (s1981), and γH2AX (s139) were analyzed by Western blot (B) and by immunofluorescence staining (C) in the immortalized NFs and CAFs. The relative fold changes of total ATM, p-ATM (s1981), and γH2AX (s139) in NFs and CAFs were displayed. Scale bars, 25 μm (*, P < 0.05). (D) The expression of p-ATM (s1981) and γH2AX (s139) in breast cancer specimens was analyzed by IHC staining. Scale bars, 50 μm. (E) The expression of p-ATM (s1981), ATM, p-AKT (s473), and AKT was determined by Western blot in NFs and CAFs in the presence or absence of KU60019 (5 μM) for 24 h.
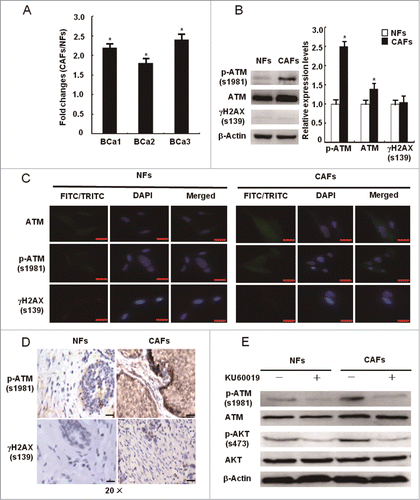
Figure 3. Mitochondria-derived ROS activate the ATM kinase. (A) CAFs were treated with or without NAC (1 mM) for 24 h. Immunoblotting analyses were done with the indicated antibodies. (B) CAFs were treated with PDTC (20 μM), DPI (10 μM), Oxypurinol (100 μM), NADPH (1 mM), Chloramphenicol (300 μM), and Rotenone (1 μM) for 2 h. The intracellular ROS levels were measured in cultures (*, P < 0.05, CAFs treated with inhibitor vs control CAFs). (C) CAFs were treated as in B. Western blots was done with the indicated antibodies (*, P < 0.05, CAFs treated with inhibitor vs control CAFs).
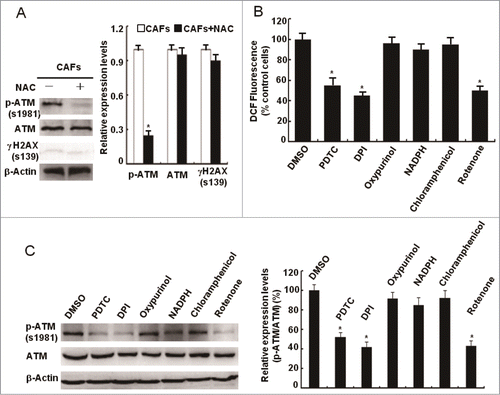
Figure 4. Loss of functional ATM by KU60019 inhibits the breast CAFs proliferation. (A) Growth curves of CAFs under treatment with or without KU60019 (5 μM) were analyzed with MTT assay for 5 d (*, P < 0.05). (B) Photomicrographs of CAFs in the presence or absence of KU60019 (5 μM) for 2 d or 3 d. Scale bars, 50 μm. (C) Flow cytometry analyses of CAFs with or without treatment of KU60019 (5 μM) for 24 h. (D) CAFs were treated with or without KU60019 (5 μM) for 24 h. Immunoblotting analyses were performed with the indicated antibodies. (*, P < 0.05).
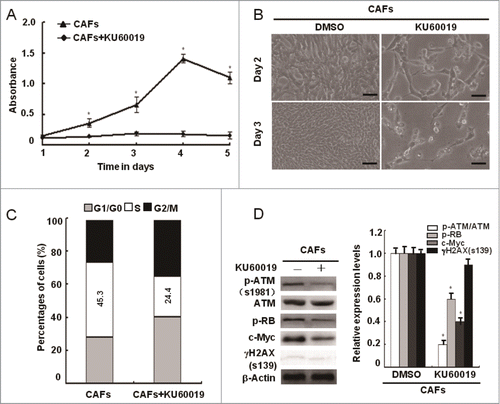
Figure 5. siRNA-mediated knockdown of ATM suppresses the breast CAFs proliferation. (A, B) The knockdown efficiency of the ATM gene by shRNA in CAFs was testified with qRT-PCR and Western Blot (*, P < 0.05, CAF-shGFP vs CAF-shATM). (C) Growth curves of CAF-shGFP and CAF-shATM were analyzed with the MTT assay for 5 d (*, P < 0.05, CAF-shGFP vs CAF-shATM at the designed time points). (D) The cell growth density of CAF-shGFP and CAF-shATM for 2 d or 3 d was displayed by Photomicrographs. Scale bars, 50 μm. (E) Flow cytometry analyses of CAF-shGFP and CAF-shATM. (F) Immunoblotting analyses were performed with the indicated antibodies in both CAF-shGFP and CAF-shATM (*, P < 0.05, CAF-shGFP vs CAF-shATM).
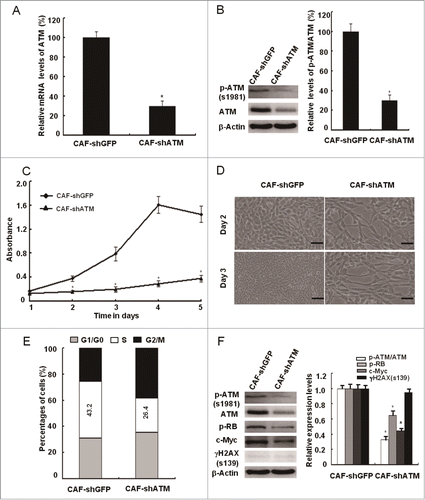
Figure 6. Maintenance of intracellular redox homeostasis by oxidized ATM plays a minor role in CAFs proliferation. (A) CAFs were pretreated with NAC (1 mM) for 2 h before treatment with KU60019 (5 μM) for 24 h. Fluorescent H2DCFDA levels were measured in these cells (*, P < 0.05 in comparing CAFs treated with or without KU60019); (#, P < 0.05 in comparing CAFs in the presence of KU60019 plus NAC-treated or NAC-untreated). (B) Growth curves of CAFs were measured by MTT assay at the indicated time points. The treatment of CAFs with KU60019 (5 μM) and NAC (1 mM) was as indicated. (*, P < 0.05, CAFs treated with KU60019+NAC vs CAFs with KU60019 only); (#, P < 0.05, CAFs treated with or without KU60019). (C) Photomicrographs of CAFs treated with KU60019 (5 μM) for 2 d in the presence or absence of NAC (1 μM). Scale bars, 50 μm. (D) Flow cytometry analyses of CAFs treated with KU60019 (5 μM) for 24 h in the presence or absence of NAC (1 μM). (E) CAFs was treated with KU60019 (5 μM) for 24 h in the presence of NAC (1 mM). Western blotting analyses were done with the indicated antibodies (*, P < 0.05, and #, P < 0.05 is similar with (B) indicated).
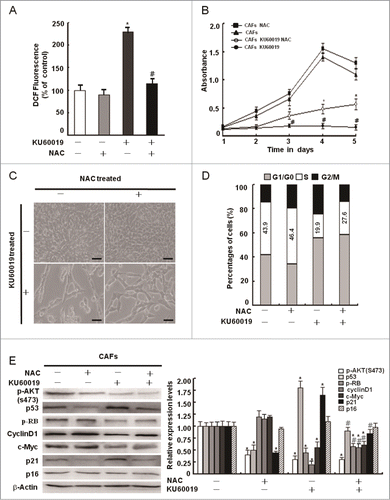
Figure 7 (See previous page). Oxidized ATM enhances the CAFs proliferation through activating key proliferation-related signaling pathways. (A) CAFs were treated with KU60019 (5 μM) for the indicated time points. Immunoblotting analyses were performed with the indicated antibodies. Total histone 3 functions as a loading control for nuclear proteins. (B) CAFs were treated separately or jointly with LY294002 (20 μM), U0126 (25 μM), and XAV939 (10 μM) for the designed time. Their growth curves were determined by MTT assay (*, P < 0.05, untreated CAFs vs treated CAFs with indicated inhibitor(s)). (C) Photomicrographs of CAFs treated with or without inhibitor(s) as in B indicated for 2 d. Scale bars, 50 μm. (D) Flow cytometry analyses of CAFs treated with indicated inhibitor(s) for 24 h as in B. (E) CAFs were treated separately or jointly with LY294002 (20 μM), U0126 (25 μM), and XAV939 (10 μM) for 24 h. Immunoblotting analysis was done with the indicated antibodies. Total histone 3 functions as a loading control for nuclear proteins. (F) CAFs were treated separately or jointly with LY294002 (20 μM), U0126 (25 μM), and XAV939 (10 μM) for 24 h. The levels of p-RB, c-Myc, p21Cip1, and p16Ink4a were analyzed by western blot. (G) CAFs were treated with KU60019 (5 μM) for the indicated time. Immunoblotting analysis was performed with the indicated antibodies.
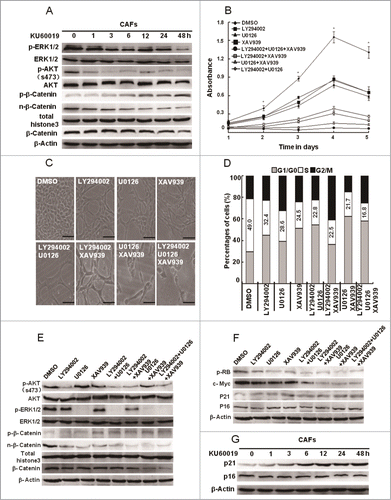
Figure 8. Loss of functional ATM leads to the proliferation defect in CAFs partially through down-regulating β-catenin and cell cycle regulation genes. (A) CAFs were treated with KU60019 (5 μM) for the indicated time. Immunoblotting analyses were performed to detect activity of GSK3β and β-Catenin. Total histone 3 functions as a loading control for nuclear proteins. (B) CAFs were treated separately or jointly with LY294002 (20 μM), U0126 (25 μM), and XAV939 (10 μM) for 24 h. Activated GSK3β and β-Catenin were determined using Immunoblotting analysis. Total histone 3 functions as a loading control for nuclear proteins. (C) CAFs were separately treated with or without inhibitors including LY294002 (20 μM), U0126 (25 μM), and XAV939 (10 μM) for 24 h. ChIP assay was done with an anti-β-catenin antibody for immunoprecipitation followed by PCR with c-MYC promoter-specific primers. (D) CAFs were separately treated with or without inhibitors including LY294002 (20 μM), U0126 (25 μM), and XAV939 (10 μM) for 24 h. Immunoblotting analysis was performed with the indicated antibodies. (E) The c-Myc gene in CAFs was knocked down by the shRNA, and the expression of c-Myc related genes was tested by Immunoblotting analysis with the indicated antibodies. β-Actin worked as loading control. (F) The growth curves of CAFs with or without c-Myc depletion was measured with the MTT assay (*, P < 0.05).
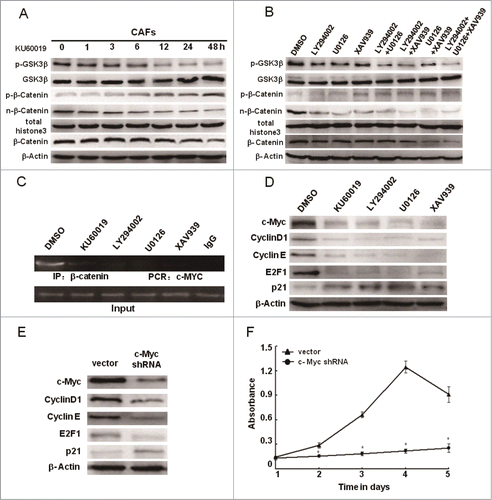
Figure 9. c-Myc mediates the functional ATM in promoting the breast CAFs proliferation. (A)The differential expression analysis of the cell cycle core regulators between NFs and CAFs was done by Western blot with the indicated antibodies. (B) The activity of key cellular proliferation regulating pathways between NFs and CAFs was determined using Western blot with the indicated antibodies. (C, D) Western blot analyzes the effect of ATM deficiency caused by KU60019 (5 μM for 24 h) on the protein expression levels of cell cycle-associated proteins (C) and the activity of key cell proliferation regulating pathways (D) in breast CAFs using the indicated antibodies. (E) A cartoon scheme is used to depict the c-Myc mediated function of oxidized ATM in promoting breast CAFs proliferation.
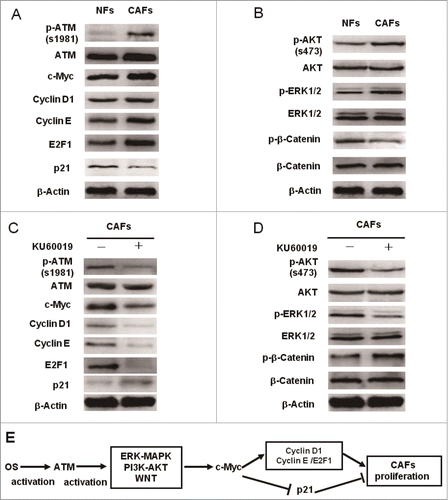
Table 1. Primers sequences for qRT-PCR
Table 2. Cell cycle related genes up-regulated in CAFs compared with NFs
Table 3. Cell cycle related genes down-regulated in CAFs compared with NFs