2,288
Views
43
CrossRef citations to date
0
Altmetric
Reports

Nuclear localized Akt enhances breast cancer stem-like cells through counter-regulation of p21Waf1/Cip1 and p27kip1

, , , , , & show all
Pages 2109-2120 | Received 13 Feb 2015, Accepted 11 Apr 2015, Published online: 17 Jun 2015

Figures & data

Figure 1. Effect of Akt-WT and Akt-NLS on PI3K-mTOR signaling. (A) Fluorescent images showing nuclear localization of Akt-NLS in cells transfected to express the Akt-NLS construct. Cytoplasmic localization of Akt-WT in cells transfected with empty construct (control). The image data were collected in SKBR3 cells using confocal microscopy. (B) Western blot analysis showing the increased levels of phosphorylated Akt (pAkt) and mTOR in SKBR3 cells. Lower panels show quantitative (densitometric) assessment of the levels of pAkt and mTOR as compared to control * P < 0.05.

Figure 1. Effect of Akt-WT and Akt-NLS on PI3K-mTOR signaling. (A) Fluorescent images showing nuclear localization of Akt-NLS in cells transfected to express the Akt-NLS construct. Cytoplasmic localization of Akt-WT in cells transfected with empty construct (control). The image data were collected in SKBR3 cells using confocal microscopy. (B) Western blot analysis showing the increased levels of phosphorylated Akt (pAkt) and mTOR in SKBR3 cells. Lower panels show quantitative (densitometric) assessment of the levels of pAkt and mTOR as compared to control * P < 0.05.

Figure 2. Flow cytometric assessment of cancer stem-like cell populations by the combination of stem cell markers ALDH, CD24 and CD44, upon overexpression of Akt-WT and Akt-NLS. (A) Akt-NLS transfected SKBR3 cells showed enhanced presence of the ALDH+/High/CD44+/High/CD24−/Low CSCs phenotype when compared to control. Akt-WT cells failed to show a marked increase in the expression of CSCs markers in SKBR3 cells. (B) Graph representing quantification of markers assessed in “A.” Enhanced expression of Akt-NLS showed a significantly increase in the CSCs population compared to Akt-WT and control. (C) Presence of Akt-NLS in SKBR3-mammospheres coincided with a higher number in ALDH+/High/CD44+/High/CD24−/Low CSCs population compared to control. Akt-WT expressing cells failed to show a marked increase in ALDH+/High/CD44+/High/CD24−/Low CSCs in SKBR3 mammospheres. (D) Graph representing quantitative evaluation of expression of markers assessed in “C.” SKBR3 cells transfected with Akt-NLS showed a significantly increased CSCs population as compared to Akt-WT cells and mock controls, *P < 0.05.

Figure 2. Flow cytometric assessment of cancer stem-like cell populations by the combination of stem cell markers ALDH, CD24 and CD44, upon overexpression of Akt-WT and Akt-NLS. (A) Akt-NLS transfected SKBR3 cells showed enhanced presence of the ALDH+/High/CD44+/High/CD24−/Low CSCs phenotype when compared to control. Akt-WT cells failed to show a marked increase in the expression of CSCs markers in SKBR3 cells. (B) Graph representing quantification of markers assessed in “A.” Enhanced expression of Akt-NLS showed a significantly increase in the CSCs population compared to Akt-WT and control. (C) Presence of Akt-NLS in SKBR3-mammospheres coincided with a higher number in ALDH+/High/CD44+/High/CD24−/Low CSCs population compared to control. Akt-WT expressing cells failed to show a marked increase in ALDH+/High/CD44+/High/CD24−/Low CSCs in SKBR3 mammospheres. (D) Graph representing quantitative evaluation of expression of markers assessed in “C.” SKBR3 cells transfected with Akt-NLS showed a significantly increased CSCs population as compared to Akt-WT cells and mock controls, *P < 0.05.

Figure 3. Role of Akt in CSC proliferation. (A) Western blot results displaying decreased phosphorylation of Akt (pAkt) after treatment with Akt inhibitor triciribine in the presence of Akt-WT and Akt-NLS when compared to control SKBR3 cells. (B) Phase-contrast images showing the inhibition of mammosphere formation upon treatment with triciribine. Inhibition of Akt phosphorylation/ activation resulted in attenuated mammosphere formation capacity in SKBR3 and MDA-MB468 cells. (C) Triciribine treatment significantly reduced the ALDH+/High/CD44+/High/CD24−/Low CSCs population in the presence of Akt-WT and Akt-NLS as compared to control SKBR3 cells. Left part of the panel shows graphs representing the quantitative assessment of CSCs marker expression after pAKT inhibition. (D) Triciribine treatment significantly reduced the ALDH+/High/CD44+/High/CD24−/Low CSCs population in mammospheres derived from Akt-WT and Akt-NLS SKBR3 as compared to mock control. Similarly, the left part of the panel shows graphs representing the quantitative evaluation of CSC marker expression after AKT inhibition *P < 0.05.
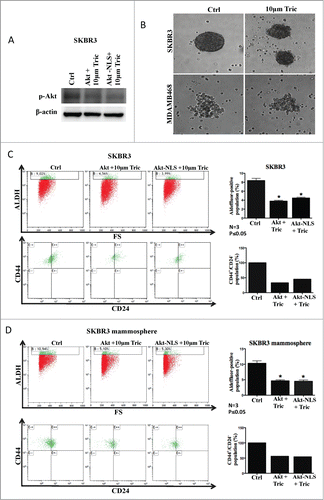
Figure 3. Role of Akt in CSC proliferation. (A) Western blot results displaying decreased phosphorylation of Akt (pAkt) after treatment with Akt inhibitor triciribine in the presence of Akt-WT and Akt-NLS when compared to control SKBR3 cells. (B) Phase-contrast images showing the inhibition of mammosphere formation upon treatment with triciribine. Inhibition of Akt phosphorylation/ activation resulted in attenuated mammosphere formation capacity in SKBR3 and MDA-MB468 cells. (C) Triciribine treatment significantly reduced the ALDH+/High/CD44+/High/CD24−/Low CSCs population in the presence of Akt-WT and Akt-NLS as compared to control SKBR3 cells. Left part of the panel shows graphs representing the quantitative assessment of CSCs marker expression after pAKT inhibition. (D) Triciribine treatment significantly reduced the ALDH+/High/CD44+/High/CD24−/Low CSCs population in mammospheres derived from Akt-WT and Akt-NLS SKBR3 as compared to mock control. Similarly, the left part of the panel shows graphs representing the quantitative evaluation of CSC marker expression after AKT inhibition *P < 0.05.

Figure 4. Expression of stem cell reprogramming markers. (A) Western blot detection of Oct4, cMyc, Nanog and Sox2 were increased in Akt-WT and Akt-NLS compared to control. In case of KLF4, a protein level was approximately the same as in Akt-WT and Akt-NLS cells compared to control. (B) Gene expression of Oct4, cMyc, Nanog and Sox2 were increased in Akt WT compared to Akt-NLS and control. In contrast, KLF4 expression is increased in Akt-NLS as compared to Akt WT and control but not significant in SKBR3 mammospheres. (C) Nuclear Akt enhanced the colony forming ability (mammosphere formation) of SKBR3 and MDA-MB468 as compared to mock cells. The mammosphere formation assay was conducted in soft agar. (D) Quantitative representation of data “C” a significantly increased number of colonies (mammosphere formation) of SKBR3 and MDA-MB468 as compared to, *P < 0.05 and ** P < 0.005.
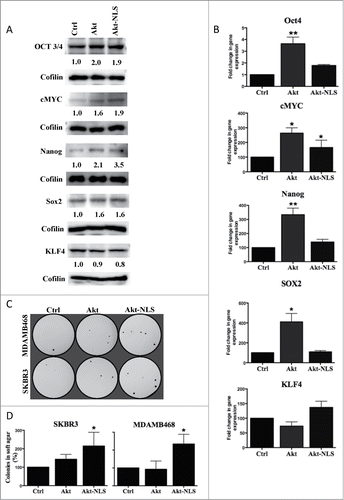
Figure 4. Expression of stem cell reprogramming markers. (A) Western blot detection of Oct4, cMyc, Nanog and Sox2 were increased in Akt-WT and Akt-NLS compared to control. In case of KLF4, a protein level was approximately the same as in Akt-WT and Akt-NLS cells compared to control. (B) Gene expression of Oct4, cMyc, Nanog and Sox2 were increased in Akt WT compared to Akt-NLS and control. In contrast, KLF4 expression is increased in Akt-NLS as compared to Akt WT and control but not significant in SKBR3 mammospheres. (C) Nuclear Akt enhanced the colony forming ability (mammosphere formation) of SKBR3 and MDA-MB468 as compared to mock cells. The mammosphere formation assay was conducted in soft agar. (D) Quantitative representation of data “C” a significantly increased number of colonies (mammosphere formation) of SKBR3 and MDA-MB468 as compared to, *P < 0.05 and ** P < 0.005.

Figure 5. Expression of cell cycle regulatory proteins. (A) Western blot detection of p21 and p27 cell cycle inhibitory proteins. Levels of phosphorylated p21 were increased in Akt-WT and Akt-NLS cells compared to control. In contrast, detectable levels of phosphorylated p27 were increased in Akt-WT compared to Akt-NLS and control in MDA-MB468 mammospheres. (B) Gene expression of p21 and p27 was increased in Akt-WT as compared to Akt-NLS and control; only p21 expression was increased in Akt-NLS as compared to control in SKBR3 mammospheres. (C) Western blot analysis of cyclin D1, cyclin E1, cyclin A1 and cyclin B1 cell cycle regulatory proteins. Levels of cyclin D1, cyclin E1 and cyclin A1 were increased in Akt-WT and Akt-NLS as compared to control. In case of cyclin B1, protein expression was similar in Akt-WT and Akt-NLS as compared to control in SKBR3 mammospheres, *P < 0.05 and **P < 0.005.

Figure 5. Expression of cell cycle regulatory proteins. (A) Western blot detection of p21 and p27 cell cycle inhibitory proteins. Levels of phosphorylated p21 were increased in Akt-WT and Akt-NLS cells compared to control. In contrast, detectable levels of phosphorylated p27 were increased in Akt-WT compared to Akt-NLS and control in MDA-MB468 mammospheres. (B) Gene expression of p21 and p27 was increased in Akt-WT as compared to Akt-NLS and control; only p21 expression was increased in Akt-NLS as compared to control in SKBR3 mammospheres. (C) Western blot analysis of cyclin D1, cyclin E1, cyclin A1 and cyclin B1 cell cycle regulatory proteins. Levels of cyclin D1, cyclin E1 and cyclin A1 were increased in Akt-WT and Akt-NLS as compared to control. In case of cyclin B1, protein expression was similar in Akt-WT and Akt-NLS as compared to control in SKBR3 mammospheres, *P < 0.05 and **P < 0.005.

Figure 6. Akt and nuclear Akt enhance cell proliferation and reduce cell death. (A) Cell cycle analysis showed a significant decrease in G0/G1 phase and increase in G2/M phase in the presence of Akt-NLS in SKBR3 derived from mammospheres. *P < 0.05. (B) Cell death was assessed using Po-Pro (apoptotic) and 7-AAD (necrotic) markers. Presence of Akt-WT and Akt-NLS resulted in reduced cell death compared to control SKBR3 cells, *P < 0.05. Control hsitogram are marked black.

Figure 6. Akt and nuclear Akt enhance cell proliferation and reduce cell death. (A) Cell cycle analysis showed a significant decrease in G0/G1 phase and increase in G2/M phase in the presence of Akt-NLS in SKBR3 derived from mammospheres. *P < 0.05. (B) Cell death was assessed using Po-Pro (apoptotic) and 7-AAD (necrotic) markers. Presence of Akt-WT and Akt-NLS resulted in reduced cell death compared to control SKBR3 cells, *P < 0.05. Control hsitogram are marked black.

Table 1. Primers utilized for the qRT-PCR experiment performed in this study

Supplemental material

1041692_supplemental_files.zip

Download Zip (1.9 MB)

Reprints and Corporate Permissions

Please note: Selecting permissions does not provide access to the full text of the article, please see our help page How do I view content?

To request a reprint or corporate permissions for this article, please click on the relevant link below:

Academic Permissions

Please note: Selecting permissions does not provide access to the full text of the article, please see our help page How do I view content?

Obtain permissions instantly via Rightslink by clicking on the button below:

If you are unable to obtain permissions via Rightslink, please complete and submit this Permissions form. For more information, please visit our Permissions help page.