850
Views
5
CrossRef citations to date
0
Altmetric
Report

p27Kip1 participates in the regulation of endoreplication in differentiating chick retinal ganglion cells

&
Pages 2311-2322 | Received 10 Mar 2015, Accepted 18 Apr 2015, Published online: 17 Jun 2015

Figures & data

Figure 1. Scheme of the mechanism inducing tetraploid RGCs in the chick retina. (A) Retinal precursors undergo S-phase (dark gray nucleus) at the basal neuroepithelium (S-phase-1), and they displace their nuclei to the apical neuroepithelium during G2, showing 4C DNA content. Then, they undergo mitosis at the apical portion of the neuroepithelium. This division gives rise to precursors with 2C DNA content that undergo a new round of interkinetic nuclear movement (see ref.Citation78). Alternatively, daughter cells may undergo neuronal differentiation (gray cytoplasm). Some of the differentiating RGCs can reactivate the cell cycle (S-phase-2) in response to NGF as they migrate to the basal neuroepithelium, where the GCL will be located. In the presence of BDNF, RGCs remain with 4C DNA content (i.e. tetraploid neurons), whereas in its absence they undergo ectopic mitosis at the basal neuroepithelium and die. (B) An illustrative image showing p75NTR-positive differentiating RGCs undergoing S-phase-2 at the apical neuroepithelium (arrows). In contrast, precursors undergoing S-phase-1 (arrowhead) are located basally. (C) An illustrative image showing an RA4-positive differentiating RGC undergoing ectopic mitosis, revealed with phosphoHistone H3 immunolabeling (pH3), at the basal neuroepithelium (arrow). In contrast, precursors undergo mitosis at the apical neuroepithelium (arrowhead). Bisb.: bisbenzimide.
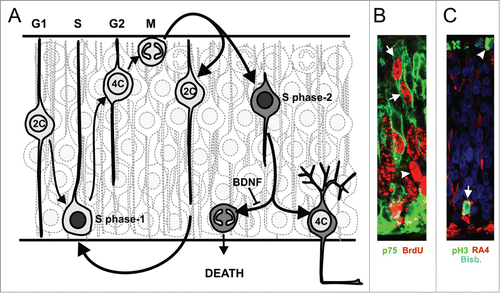
Figure 1. Scheme of the mechanism inducing tetraploid RGCs in the chick retina. (A) Retinal precursors undergo S-phase (dark gray nucleus) at the basal neuroepithelium (S-phase-1), and they displace their nuclei to the apical neuroepithelium during G2, showing 4C DNA content. Then, they undergo mitosis at the apical portion of the neuroepithelium. This division gives rise to precursors with 2C DNA content that undergo a new round of interkinetic nuclear movement (see ref.Citation78). Alternatively, daughter cells may undergo neuronal differentiation (gray cytoplasm). Some of the differentiating RGCs can reactivate the cell cycle (S-phase-2) in response to NGF as they migrate to the basal neuroepithelium, where the GCL will be located. In the presence of BDNF, RGCs remain with 4C DNA content (i.e. tetraploid neurons), whereas in its absence they undergo ectopic mitosis at the basal neuroepithelium and die. (B) An illustrative image showing p75NTR-positive differentiating RGCs undergoing S-phase-2 at the apical neuroepithelium (arrows). In contrast, precursors undergoing S-phase-1 (arrowhead) are located basally. (C) An illustrative image showing an RA4-positive differentiating RGC undergoing ectopic mitosis, revealed with phosphoHistone H3 immunolabeling (pH3), at the basal neuroepithelium (arrow). In contrast, precursors undergo mitosis at the apical neuroepithelium (arrowhead). Bisb.: bisbenzimide.

Figure 2. p27Kip1 expression in the E5 chick retina. Confocal sections from retinas of E5 chick embryos double labeled with an anti-p27Kip1 specific antibody (red) and antibodies (green) specific for p75NTR (A), G4 (B), TrkB (C), or Rb (D) are shown. Nuclear staining with bisbenzimide in blue (Bisb.). p27Kip1 expression can be detected in the pigment epithelium (arrows) and layered differentiating RGCs in the GCL (arrowheads). (A) p75NTR-positive cells co-localize with p27Kip1. (B) p27Kip1 is expressed in differentiated CGRs expressing G4. (C) TrkB expressing cells also express p27kip1. (D) p27kip1 is expressed by RGCs lacking Rb. Boxes: high magnification of the framed areas. GCL: ganglion cell layer; PE: pigment epithelium; v: vitreous body. Bar: 20 μm.
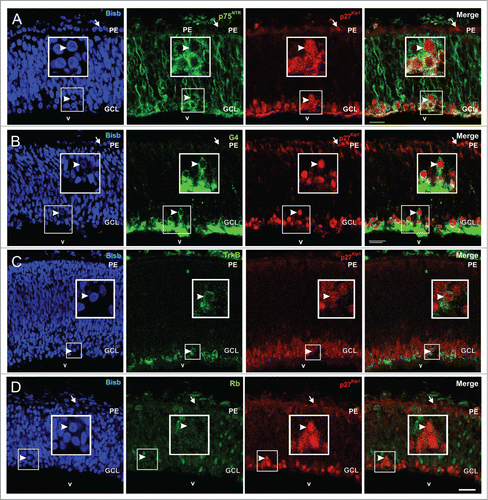
Figure 2. p27Kip1 expression in the E5 chick retina. Confocal sections from retinas of E5 chick embryos double labeled with an anti-p27Kip1 specific antibody (red) and antibodies (green) specific for p75NTR (A), G4 (B), TrkB (C), or Rb (D) are shown. Nuclear staining with bisbenzimide in blue (Bisb.). p27Kip1 expression can be detected in the pigment epithelium (arrows) and layered differentiating RGCs in the GCL (arrowheads). (A) p75NTR-positive cells co-localize with p27Kip1. (B) p27Kip1 is expressed in differentiated CGRs expressing G4. (C) TrkB expressing cells also express p27kip1. (D) p27kip1 is expressed by RGCs lacking Rb. Boxes: high magnification of the framed areas. GCL: ganglion cell layer; PE: pigment epithelium; v: vitreous body. Bar: 20 μm.

Figure 3. p27Kip1 is expressed by RGCs in vitro. E6 chick retinal cells were cultured under neurogenic conditions for 20 h, fixed and immunostained with antibodies against G4 (green) and p27Kip1 (red). Only differentiated RGCs neurons (G4+ cells) express p27Kip1. Nuclear staining with bisbenzimide (Bisb.) is shown in blue. Bar: 20 μm.
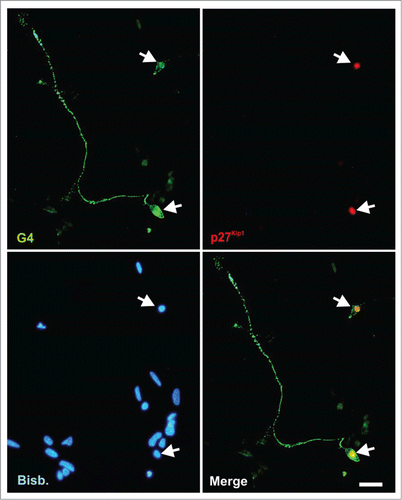
Figure 3. p27Kip1 is expressed by RGCs in vitro. E6 chick retinal cells were cultured under neurogenic conditions for 20 h, fixed and immunostained with antibodies against G4 (green) and p27Kip1 (red). Only differentiated RGCs neurons (G4+ cells) express p27Kip1. Nuclear staining with bisbenzimide (Bisb.) is shown in blue. Bar: 20 μm.

Figure 4. p27Kip1 downregulation increases BrdU incorporation and DNA amount in cultures enriched in RGCs. (A) E5 chick retinal cells were transfected with shRNA vectors designed against different regions of the Cdkn1b gene (1p27i and 2p27i) or a control shRNA vector against luciferase (Luc-i), and then cultured for 20 h under neurogenic conditions. Then, p27Kip1 expression levels were quantified by image analysis in differentiated chick retinal neurons transfected with the shRNA or control vectors. Both Cdkn1b-specific constructs were able to significantly decrease the expression levels of p27Kip1 as compared with the control construct. (B) RGC-enriched retinal cultures were obtained from E7 chick embryos as described by ref.Citation52. These cells were then lipofected with Luc-i, 1p27i, or 2p27i vectors and then treated with 0.5 mg/ml BrdU for 20 h. The percentaje of neurons (NeuN+ cells) incorporating BrdU was significantly increased in the presence of p27Kip1-specific shRNA compared to the control (RFPi). (C) The frequency of non-diploid neurons (>2C) with a DNA content higher than 4C (>4C) was significantly increased in the presence of p27Kip1-specific shRNA compared to the control (RFPi). *P < 0.01; ***P < 0.001 (Student´s t test, n = 3).
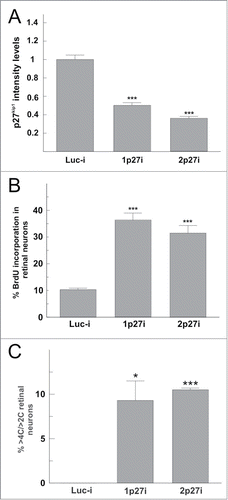
Figure 4. p27Kip1 downregulation increases BrdU incorporation and DNA amount in cultures enriched in RGCs. (A) E5 chick retinal cells were transfected with shRNA vectors designed against different regions of the Cdkn1b gene (1p27i and 2p27i) or a control shRNA vector against luciferase (Luc-i), and then cultured for 20 h under neurogenic conditions. Then, p27Kip1 expression levels were quantified by image analysis in differentiated chick retinal neurons transfected with the shRNA or control vectors. Both Cdkn1b-specific constructs were able to significantly decrease the expression levels of p27Kip1 as compared with the control construct. (B) RGC-enriched retinal cultures were obtained from E7 chick embryos as described by ref.Citation52. These cells were then lipofected with Luc-i, 1p27i, or 2p27i vectors and then treated with 0.5 mg/ml BrdU for 20 h. The percentaje of neurons (NeuN+ cells) incorporating BrdU was significantly increased in the presence of p27Kip1-specific shRNA compared to the control (RFPi). (C) The frequency of non-diploid neurons (>2C) with a DNA content higher than 4C (>4C) was significantly increased in the presence of p27Kip1-specific shRNA compared to the control (RFPi). *P < 0.01; ***P < 0.001 (Student´s t test, n = 3).

Figure 5. Enrichment of RGCs through a Percoll gradient. βIII tubulin staining (βIII Tub.) performed in a culture enriched in RGCs. Nuclei were stained with bisbenzimide (Bisb.). Bar: 20 μm.
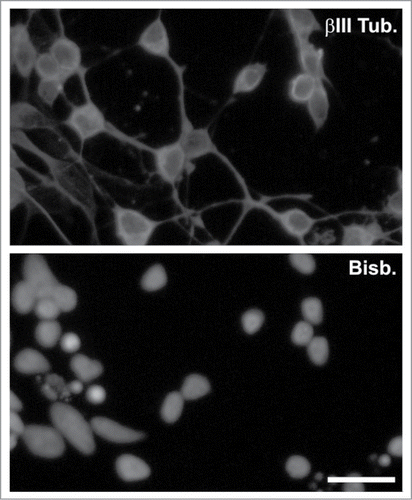
Figure 5. Enrichment of RGCs through a Percoll gradient. βIII tubulin staining (βIII Tub.) performed in a culture enriched in RGCs. Nuclei were stained with bisbenzimide (Bisb.). Bar: 20 μm.

Figure 6. BrdU incorporation in RGCs, but not in retinal precursors, is independent of Cdk4/6 activity. (A) The selective Cdk4/6 inhibitor PD 0332991, used at 400 nM, prevents the capacity of E6 retinal precursor cells to incorporate BrdU after a short pulse (30 min). The analysis was performed after 20 h of inhibitor treatment. (B) RGC-enriched retinal cultures were lipofected with Luc-i, 1p27i, or 2p27i vectors and treated with 0.5 mg/ml BrdU for 20 h in the presence (+) or absence (−) of 400 nM PD 0332991. BrdU incorporation was evaluated in Brn3a-positive cells (a subpopulation of RGCs). (C) RGC-enriched retinal cultures treated as described above. BrdU incorporation was evaluated in cells that display RGC morphology (monoaxonic cells with round cytoplasm). *P < 0.01; **P < 0.005; ***P < 0.001 (Student´s t test, n = 3).

Figure 6. BrdU incorporation in RGCs, but not in retinal precursors, is independent of Cdk4/6 activity. (A) The selective Cdk4/6 inhibitor PD 0332991, used at 400 nM, prevents the capacity of E6 retinal precursor cells to incorporate BrdU after a short pulse (30 min). The analysis was performed after 20 h of inhibitor treatment. (B) RGC-enriched retinal cultures were lipofected with Luc-i, 1p27i, or 2p27i vectors and treated with 0.5 mg/ml BrdU for 20 h in the presence (+) or absence (−) of 400 nM PD 0332991. BrdU incorporation was evaluated in Brn3a-positive cells (a subpopulation of RGCs). (C) RGC-enriched retinal cultures treated as described above. BrdU incorporation was evaluated in cells that display RGC morphology (monoaxonic cells with round cytoplasm). *P < 0.01; **P < 0.005; ***P < 0.001 (Student´s t test, n = 3).

Figure 7. RGCs with a DNA content higher than 4C are not present in the p27Kip1−/− mouse retina. Cell nuclei isolated from the retina of either p27Kip1+/+ (A) or p27Kip1−/− (B) P2 mice were immunostained for the RGC marker Brn3a, treated with PI (DNA content), and then analyzed by flow cytometry (n = 3 for each genotype). Representative DNA content histograms are shown for Brn3a+ nuclei. No net increase of RGCs with a DNA content above 4C can be seen in p27Kip1−/− retinas.
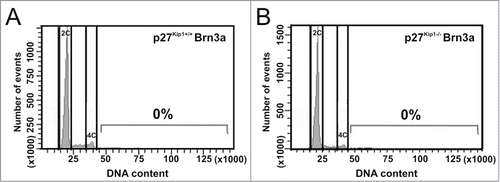
Figure 7. RGCs with a DNA content higher than 4C are not present in the p27Kip1−/− mouse retina. Cell nuclei isolated from the retina of either p27Kip1+/+ (A) or p27Kip1−/− (B) P2 mice were immunostained for the RGC marker Brn3a, treated with PI (DNA content), and then analyzed by flow cytometry (n = 3 for each genotype). Representative DNA content histograms are shown for Brn3a+ nuclei. No net increase of RGCs with a DNA content above 4C can be seen in p27Kip1−/− retinas.