843
Views
17
CrossRef citations to date
0
Altmetric
Report

Cyclin-dependent kinase regulatory subunit 1 promotes cell proliferation by insulin regulation

, , &
Pages 3045-3057 | Received 21 Jan 2015, Accepted 16 May 2015, Published online: 26 Aug 2015

Figures & data

Figure 1. qRT-PCR results showing the expression profile of CKS1 in various tissues. The expression profile of CKS1 in the epidermis (A), midgut (B), and fat body (C) with β-actin as the quantity and quality control. These experiments were repeated thrice and statistically analyzed. F: feeding stage; M: molting stage; MM: metamorphic molting.
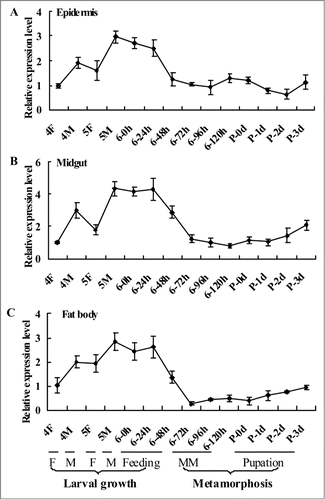
Figure 1. qRT-PCR results showing the expression profile of CKS1 in various tissues. The expression profile of CKS1 in the epidermis (A), midgut (B), and fat body (C) with β-actin as the quantity and quality control. These experiments were repeated thrice and statistically analyzed. F: feeding stage; M: molting stage; MM: metamorphic molting.

Figure 2. CKS1 knockdown blocks larval growth, delays pupation, and forms small-sized pupae. Insect phenotype after CKS1 knockdown by injecting non-overlapping dsCKS1 produced by N-terminus (N) and C-terminus (C), respectively, to fifth instar 12 h larvae (500 ng/larva, 3 times in 48 h interval). n and c: Larvae from control groups injected with the same quantity of dsGFP; n1 and c1: dead larvae at the sixth feeding stage; n2 and c2: dead larvae at the sixth metamorphic molting stage; n3 and c3, small-sized pupae; (B) percentage of distribution of different phenotypes in (A); (C) statistical analysis of average body weight of pupae after CKS1 knockdown by injecting dsCKS1(N) and dsCKS1(C), with dsGFP injection as the control; (D) statistical analysis of pupation time after dsRNA injection. (E and F), qRT-PCR analyzing the specificity of RNAi by dsCKS1(N) and dsCKS1(C), 24 h post dsRNA injection in 5th 12 h larval midgut. These experiments were repeated thrice (30 larvae × 3) and statistically analyzed. The asterisks indicate significant differences from the control group (P < 0.05) by using the student's t test.
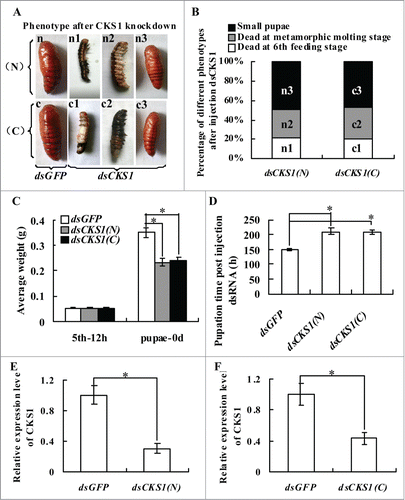
Figure 2. CKS1 knockdown blocks larval growth, delays pupation, and forms small-sized pupae. Insect phenotype after CKS1 knockdown by injecting non-overlapping dsCKS1 produced by N-terminus (N) and C-terminus (C), respectively, to fifth instar 12 h larvae (500 ng/larva, 3 times in 48 h interval). n and c: Larvae from control groups injected with the same quantity of dsGFP; n1 and c1: dead larvae at the sixth feeding stage; n2 and c2: dead larvae at the sixth metamorphic molting stage; n3 and c3, small-sized pupae; (B) percentage of distribution of different phenotypes in (A); (C) statistical analysis of average body weight of pupae after CKS1 knockdown by injecting dsCKS1(N) and dsCKS1(C), with dsGFP injection as the control; (D) statistical analysis of pupation time after dsRNA injection. (E and F), qRT-PCR analyzing the specificity of RNAi by dsCKS1(N) and dsCKS1(C), 24 h post dsRNA injection in 5th 12 h larval midgut. These experiments were repeated thrice (30 larvae × 3) and statistically analyzed. The asterisks indicate significant differences from the control group (P < 0.05) by using the student's t test.

Figure 3. CKS1 expression determines body size. (A) phenotypes after dsCKS1 injection at different larval stages (fifth 12 h, sixth 6 h, sixth 24 h and sixth 48 h, 500 ng/larva, 24 h interval for 3 times injection), dsGFP injection at different larval stages with the same condition as the control group; (B) qRT-PCR to detect the effects of RNAi in the midgut, 24 h post the first dsRNA injection. The asterisks indicate significant differences from the control group (P < 0.05) by using the student's t test. (C) calculation of average pupae weight in (A); (D) calculation of average mortality rate in (A). The average was from 3 repeats (20 larvae × 3).
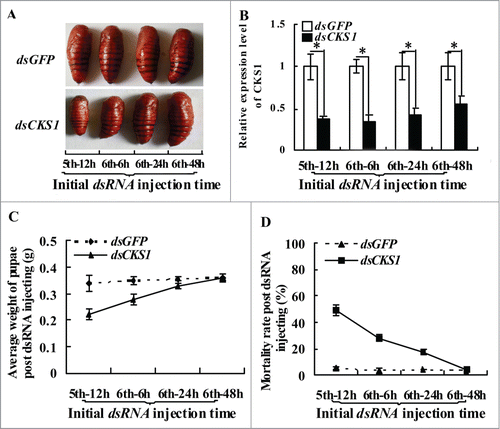
Figure 3. CKS1 expression determines body size. (A) phenotypes after dsCKS1 injection at different larval stages (fifth 12 h, sixth 6 h, sixth 24 h and sixth 48 h, 500 ng/larva, 24 h interval for 3 times injection), dsGFP injection at different larval stages with the same condition as the control group; (B) qRT-PCR to detect the effects of RNAi in the midgut, 24 h post the first dsRNA injection. The asterisks indicate significant differences from the control group (P < 0.05) by using the student's t test. (C) calculation of average pupae weight in (A); (D) calculation of average mortality rate in (A). The average was from 3 repeats (20 larvae × 3).

Figure 4. Examination of midgut cell proliferation and PCD from 4th instar to 6th instar based on immunohistochemistry analysis. Panels a1 to h1, DAPI staining showing the nuclei of midgut cells; a2 to h2, magnification of a1 to h1; a3 to h3, phospho-histone 3 detection using the antibody and goat anti-mouse IgG Alexa-Fluor 488 (green) showing cell proliferation; a4 to h4, TUNEL staining showing the midgut PCD. Bar indicates 50 μm.
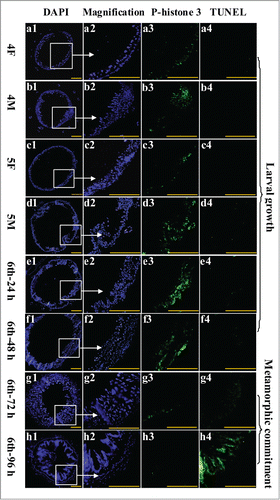
Figure 4. Examination of midgut cell proliferation and PCD from 4th instar to 6th instar based on immunohistochemistry analysis. Panels a1 to h1, DAPI staining showing the nuclei of midgut cells; a2 to h2, magnification of a1 to h1; a3 to h3, phospho-histone 3 detection using the antibody and goat anti-mouse IgG Alexa-Fluor 488 (green) showing cell proliferation; a4 to h4, TUNEL staining showing the midgut PCD. Bar indicates 50 μm.

Figure 5. Midgut cell proliferation occurs in the larval regenerative cells. Panel 1, HE staining showing the midgut cells in fourth instar feeding larvae, cc: columnar cells, gc: goblet cells, rc: regenerative cells; panel 2, phospho-histone 3 antibody detection showing the proliferating cells; panel 3, DAPI staining showing the cell nucleus; panel 4, merged image of panels 2 and 3; panel 5, HE staining showing the midgut of sixth instar 96 h larvae, LM: larval midgut, IM: imaginal midgut; panel 6, phospho-histone 3 antibody detection; panel 7, DAPI staining; panel 8, merged image of panels 6 and 7. Bar indicates 20 μm.
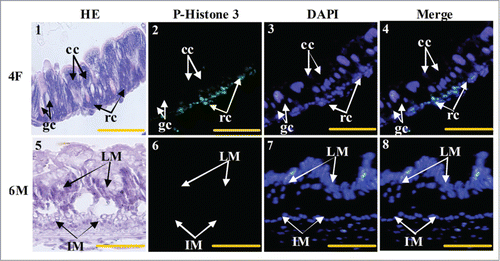
Figure 5. Midgut cell proliferation occurs in the larval regenerative cells. Panel 1, HE staining showing the midgut cells in fourth instar feeding larvae, cc: columnar cells, gc: goblet cells, rc: regenerative cells; panel 2, phospho-histone 3 antibody detection showing the proliferating cells; panel 3, DAPI staining showing the cell nucleus; panel 4, merged image of panels 2 and 3; panel 5, HE staining showing the midgut of sixth instar 96 h larvae, LM: larval midgut, IM: imaginal midgut; panel 6, phospho-histone 3 antibody detection; panel 7, DAPI staining; panel 8, merged image of panels 6 and 7. Bar indicates 20 μm.

Figure 6. CKS1 knockdown represses cell proliferation and gene expression in the larval midgut. dsCKS1 was injected to the fifth instar 12 h larvae twice, 48 h interval, 500 ng/larva. dsGFP injection was the non-specific RNAi control. (A) Immunohistochemistry showing the repress of midgut cell proliferation by CKS1 knowckdown. Panel 1, efficacy of CKS1 knockdown examined at the sixth instar 24 h larvae; panel 2, phenotypes related to panel 1; panels 3 to 5, detection of cell proliferation after dsGFP injection by the antibody against phospho-histone 3 and goat anti-mouse IgG Alexa-Fluor 488 (green) second antibody; panels 6 to 8, detection of cell proliferation by anti-phospho-histone 3 primary antibody after dsCKS1 injection. Bar indicates 50 μm. The white arrows pointed to the amplification of the pictures. (B) HE-stained midguts at 6th 96 h after dsGFP or dsCKS1 was injected. LM: larval midgut, LU: lumen of midgut, IM: imaginal midgut. The scale bar is 50 μm. (C) qRT-PCR showing the gene expression after CKS1 knockdown in larval midgut. Asterisks indicate significant differences from the control group (P < 0.05) by using the student's t test based 3 independent repeats.
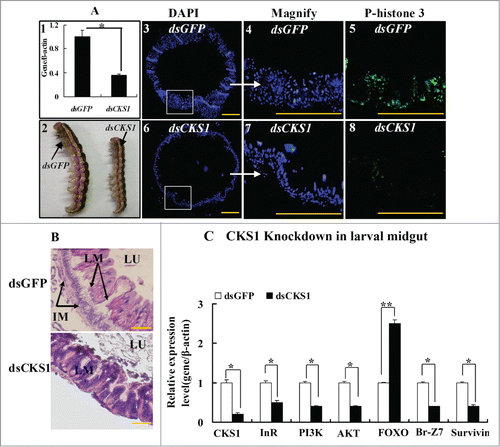
Figure 6. CKS1 knockdown represses cell proliferation and gene expression in the larval midgut. dsCKS1 was injected to the fifth instar 12 h larvae twice, 48 h interval, 500 ng/larva. dsGFP injection was the non-specific RNAi control. (A) Immunohistochemistry showing the repress of midgut cell proliferation by CKS1 knowckdown. Panel 1, efficacy of CKS1 knockdown examined at the sixth instar 24 h larvae; panel 2, phenotypes related to panel 1; panels 3 to 5, detection of cell proliferation after dsGFP injection by the antibody against phospho-histone 3 and goat anti-mouse IgG Alexa-Fluor 488 (green) second antibody; panels 6 to 8, detection of cell proliferation by anti-phospho-histone 3 primary antibody after dsCKS1 injection. Bar indicates 50 μm. The white arrows pointed to the amplification of the pictures. (B) HE-stained midguts at 6th 96 h after dsGFP or dsCKS1 was injected. LM: larval midgut, LU: lumen of midgut, IM: imaginal midgut. The scale bar is 50 μm. (C) qRT-PCR showing the gene expression after CKS1 knockdown in larval midgut. Asterisks indicate significant differences from the control group (P < 0.05) by using the student's t test based 3 independent repeats.

Figure 7. CKS1 overexpression in HaEpi cells leads to cell proliferation. (A) Detection of cell proliferation by the phospho-histone 3 antibody. Green fluorescence indicates overexpressed GFP or CKS1-GFP, and red fluorescence indicates the phospho-histone 3 detected by the phospho-histone 3 antibody and goat anti-mouse IgG Alexa-Fluor 568 (red). Blue indicates cell nucleus stained by DAPI. Merge is the overlapped red, green and blue. Panels 1 to 4, overexpressed-GFP; panels 5 to 8, overexpressed CKS1-GFP, bar indicates 20 μm; (B) statistic analysis of P-histone 3-staining cells according to the images in Figure S8A. (C) Western blot to confirm the expression and subcellular distribution of GFP and CKS1-GFP with His-taq that were detected by the monoclonal antibody anti-His-tag. Lanes 1 and 2, overexpressed GFP and CKS1-GFP, β-actin was used as the loading control; lanes 3 and 4, subcellular distribution of overexpressed GFP; lanes 5 and 6, subcellular distribution of overexpressed CKS1-GFP. SDS-PAGE gel with commassie Brilliant Blue staining was performed at the same time as loading control to normalize the protein quantity and quality in the cytosal and nucleus. cy: cytoplasm, Nu: nucleus. Bar indicates 20 μm. (D) Detection of cell proliferation by EdU. Green fluorescence indicates overexpressed GFP or CKS1-GFP, and red fluorescence indicates EdU staining; blue indicates cell nucleus stained by DAPI; merge is the overlapped red, green and blue. Bar: 20 μm. (E) Statistic analysis of EdU-staining cells according to the images in Figure S8B. Asterisks indicate significant differences between the groups (P < 0.05) by the student's t test based on 3 independent experiments.
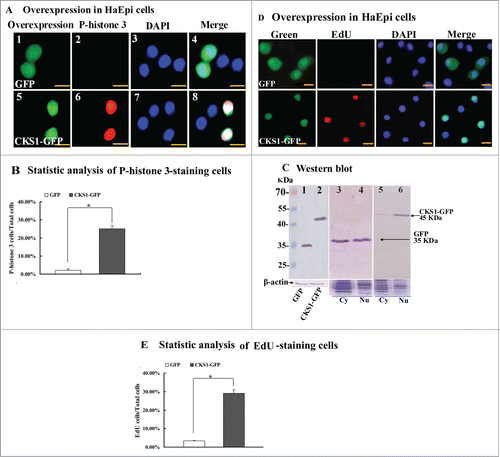
Figure 7. CKS1 overexpression in HaEpi cells leads to cell proliferation. (A) Detection of cell proliferation by the phospho-histone 3 antibody. Green fluorescence indicates overexpressed GFP or CKS1-GFP, and red fluorescence indicates the phospho-histone 3 detected by the phospho-histone 3 antibody and goat anti-mouse IgG Alexa-Fluor 568 (red). Blue indicates cell nucleus stained by DAPI. Merge is the overlapped red, green and blue. Panels 1 to 4, overexpressed-GFP; panels 5 to 8, overexpressed CKS1-GFP, bar indicates 20 μm; (B) statistic analysis of P-histone 3-staining cells according to the images in Figure S8A. (C) Western blot to confirm the expression and subcellular distribution of GFP and CKS1-GFP with His-taq that were detected by the monoclonal antibody anti-His-tag. Lanes 1 and 2, overexpressed GFP and CKS1-GFP, β-actin was used as the loading control; lanes 3 and 4, subcellular distribution of overexpressed GFP; lanes 5 and 6, subcellular distribution of overexpressed CKS1-GFP. SDS-PAGE gel with commassie Brilliant Blue staining was performed at the same time as loading control to normalize the protein quantity and quality in the cytosal and nucleus. cy: cytoplasm, Nu: nucleus. Bar indicates 20 μm. (D) Detection of cell proliferation by EdU. Green fluorescence indicates overexpressed GFP or CKS1-GFP, and red fluorescence indicates EdU staining; blue indicates cell nucleus stained by DAPI; merge is the overlapped red, green and blue. Bar: 20 μm. (E) Statistic analysis of EdU-staining cells according to the images in Figure S8B. Asterisks indicate significant differences between the groups (P < 0.05) by the student's t test based on 3 independent experiments.

Figure 8. N45 in the CKS domain has a critical effect on the function of CKS1 in cell proliferation. (A) protein sequence of H. armigera CKS1; shadowed amino acids are the CKS domain; (B) models for truncation mutants of CKS1; (C) overexpression (OE) of mutants b2, b3, and b4; green color indicates overexpressed mutants; red color indicates phospho-histone 3 detected by the specific antibody and goat anti-mouse IgG Alexa-Fluor 568 (red); blue indicates the nucleus stained by DAPI; merge shows the overlapped green, red, and blue color; (D) OE of site mutation N45G (45N to G). Bar indicates 20 μm.
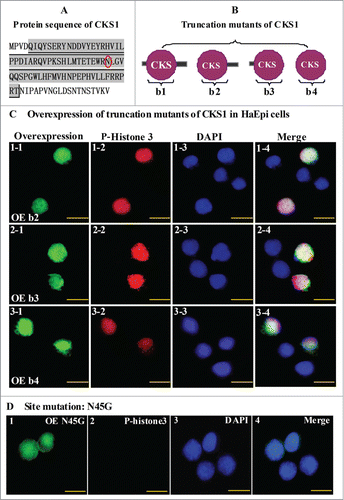
Figure 8. N45 in the CKS domain has a critical effect on the function of CKS1 in cell proliferation. (A) protein sequence of H. armigera CKS1; shadowed amino acids are the CKS domain; (B) models for truncation mutants of CKS1; (C) overexpression (OE) of mutants b2, b3, and b4; green color indicates overexpressed mutants; red color indicates phospho-histone 3 detected by the specific antibody and goat anti-mouse IgG Alexa-Fluor 568 (red); blue indicates the nucleus stained by DAPI; merge shows the overlapped green, red, and blue color; (D) OE of site mutation N45G (45N to G). Bar indicates 20 μm.

Figure 9. CKS1 is upregulated by the insulin and repressed by 20E. (A) Starvation and rescue experiments in the larvae The sixth instar 6 h larvae were fed with normal diet, 5% casein (in 2% agarose, starvation), or 5% casein (24 h) plus insulin injection (2 μg/larva, rescue) for 6 h; (B) insulin (2 μg/larva) injection at the sixth instar 6 h larvae; (C) effect of 20E injection on CKS1 expression in sixth instar 6 h larvae for 6 h (50/100/500 ng/larva). (D) Effect of 20E (50/100/500 ng/larva) on insulin (2 μg/larva)-induced CKS1 expression in 6 h; The asterisks indicate significant differences from the control group (P < 0.05) by using the student's t test based triplicates.
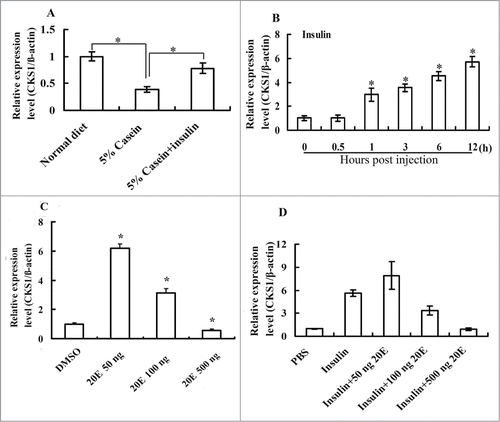
Figure 9. CKS1 is upregulated by the insulin and repressed by 20E. (A) Starvation and rescue experiments in the larvae The sixth instar 6 h larvae were fed with normal diet, 5% casein (in 2% agarose, starvation), or 5% casein (24 h) plus insulin injection (2 μg/larva, rescue) for 6 h; (B) insulin (2 μg/larva) injection at the sixth instar 6 h larvae; (C) effect of 20E injection on CKS1 expression in sixth instar 6 h larvae for 6 h (50/100/500 ng/larva). (D) Effect of 20E (50/100/500 ng/larva) on insulin (2 μg/larva)-induced CKS1 expression in 6 h; The asterisks indicate significant differences from the control group (P < 0.05) by using the student's t test based triplicates.

Figure 10. qRT-PCR showing the regulation of CKS1 by insulin via InR. (A) Knockdown of InR, (B) knockdown of PI3K, (C) knockdown of AKT, (D) knockdown of FOXO. 1*PBS is used as the solvent control for insulin, dsGFP as the non-specific dsRNA control for dsCKS1. These experiments were repeated 3 times and statistically analyzed. The asterisks indicate significant differences from the control group (P < 0.05) by using the student's t test.
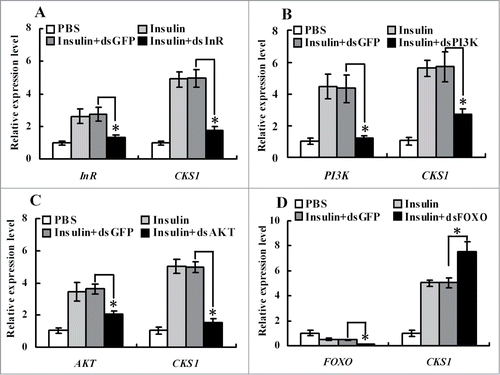
Figure 10. qRT-PCR showing the regulation of CKS1 by insulin via InR. (A) Knockdown of InR, (B) knockdown of PI3K, (C) knockdown of AKT, (D) knockdown of FOXO. 1*PBS is used as the solvent control for insulin, dsGFP as the non-specific dsRNA control for dsCKS1. These experiments were repeated 3 times and statistically analyzed. The asterisks indicate significant differences from the control group (P < 0.05) by using the student's t test.

Figure 11. Illustration of the function and hormonal regulation of CKS1 in insect development. (1) insulin via its receptor InR promotes CKS1 expression for cell proliferation and larval growth to reach to critical body weight; (2) the last instar larvae produces high titer of 20E to repress CKS1 expression.
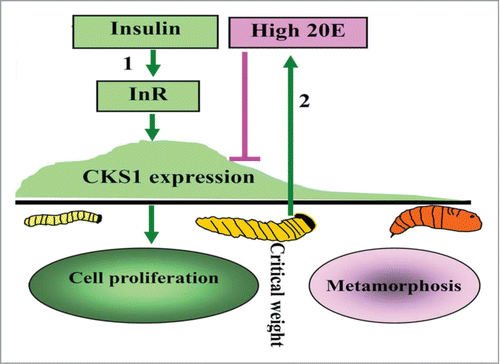
Figure 11. Illustration of the function and hormonal regulation of CKS1 in insect development. (1) insulin via its receptor InR promotes CKS1 expression for cell proliferation and larval growth to reach to critical body weight; (2) the last instar larvae produces high titer of 20E to repress CKS1 expression.
Supplemental material

1053664_supplemental_files.doc

Download MS Word (10.3 MB)

Reprints and Corporate Permissions

Please note: Selecting permissions does not provide access to the full text of the article, please see our help page How do I view content?

To request a reprint or corporate permissions for this article, please click on the relevant link below:

Academic Permissions

Please note: Selecting permissions does not provide access to the full text of the article, please see our help page How do I view content?

Obtain permissions instantly via Rightslink by clicking on the button below:

If you are unable to obtain permissions via Rightslink, please complete and submit this Permissions form. For more information, please visit our Permissions help page.