2,225
Views
16
CrossRef citations to date
0
Altmetric
Report

A fluorescent bimolecular complementation screen reveals MAF1, RNF7 and SETD3 as PCNA-associated proteins in human cells

, &
Pages 2509-2519 | Received 05 Mar 2015, Accepted 16 May 2015, Published online: 06 Jul 2015

Figures & data

Figure 1. Production of a bait cell line for the BiFC screen. (A) Schematic of the BiFC principle and constructs used. The C-terminal and N-terminal portions of Venus fluorescent protein are individually non-fluorescent but they fold to a fluorescent state when brought into proximity by the interaction of bait and prey proteins. The bait construct is based on pcDNA3.1 and produces PCNA protein fused to a linker, the C-terminal 80 amino acids of Venus, a nuclear localization signal (NLS) and a FLAG epitope. The prey construct is based on the episomally maintained pCEP4 plasmid and produces the product of the library cDNA with an NLS, an HA epitope, the first 158 amino acids of Venus and a linker region fused at its N-terminus. (B) The PCNA bait construct localizes to replication factories. MRC5 cells were transfected as indicated and then processed for immunofluorescence and EdU detection after a 10 minute EdU incorporation and triton extraction prior to fixation. EdU is incorporated at sites of DNA synthesis and was visualised using a click reaction and Alexa Fluor 647 azide (magenta). An anti-FLAG mouse monoclonal antibody was used with an anti-mouse IgG Alexa Fluor 488 secondary antibody to visualize the bait protein (green). Images were acquired using confocal microscopy at excitation wavelengths: 405 nm (DAPI nuclear stain); 488 nm (bait), 633 nm (DNA replication foci). Bar = 10µm. (C) The PCNA bait interacts with endogenous PCNA. Soluble nuclease-treated protein extracts were prepared from HEK293 cells or derivatives of (CTV and PCNA_CTV). PCNA_CTV was immuno-precipitated using the anti-FLAG monoclonal antibody and precipitates and input extracts analyzed by western blotting using anti-PCNA antibody. *non-specific band or degradation product.
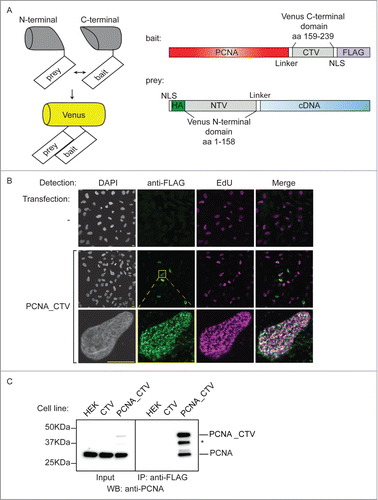
Figure 1. Production of a bait cell line for the BiFC screen. (A) Schematic of the BiFC principle and constructs used. The C-terminal and N-terminal portions of Venus fluorescent protein are individually non-fluorescent but they fold to a fluorescent state when brought into proximity by the interaction of bait and prey proteins. The bait construct is based on pcDNA3.1 and produces PCNA protein fused to a linker, the C-terminal 80 amino acids of Venus, a nuclear localization signal (NLS) and a FLAG epitope. The prey construct is based on the episomally maintained pCEP4 plasmid and produces the product of the library cDNA with an NLS, an HA epitope, the first 158 amino acids of Venus and a linker region fused at its N-terminus. (B) The PCNA bait construct localizes to replication factories. MRC5 cells were transfected as indicated and then processed for immunofluorescence and EdU detection after a 10 minute EdU incorporation and triton extraction prior to fixation. EdU is incorporated at sites of DNA synthesis and was visualised using a click reaction and Alexa Fluor 647 azide (magenta). An anti-FLAG mouse monoclonal antibody was used with an anti-mouse IgG Alexa Fluor 488 secondary antibody to visualize the bait protein (green). Images were acquired using confocal microscopy at excitation wavelengths: 405 nm (DAPI nuclear stain); 488 nm (bait), 633 nm (DNA replication foci). Bar = 10µm. (C) The PCNA bait interacts with endogenous PCNA. Soluble nuclease-treated protein extracts were prepared from HEK293 cells or derivatives of (CTV and PCNA_CTV). PCNA_CTV was immuno-precipitated using the anti-FLAG monoclonal antibody and precipitates and input extracts analyzed by western blotting using anti-PCNA antibody. *non-specific band or degradation product.

Figure 2. The BiFC approach reports on physiologically relevant protein interactions. (A) BiFC visualized by confocal microscopy. HEK293 cells stably expressing PCNA_CTV were transfected as indicated. Cells were processed for indirect immunofluorescence using a mouse anti-HA monoclonal primary antibody and goat anti-mouse Alexa Fluor 633 secondary antibody to detect the prey constructs (magenta) and BiFC signal was detected in the yellow channel, pseudo colored here in green. Bar = 10 µm. BiFC signal is specifically detected when the bait and prey constructs are able to interact. (B) BiFC detected by flow cytometry. PCNA_CTV expressing cells were transfected as indicated and yellow fluorescence monitored after 24 hours on a MoFlo cytometer. The percentage of cells above a threshold of 108 fluorescent units is indicated.
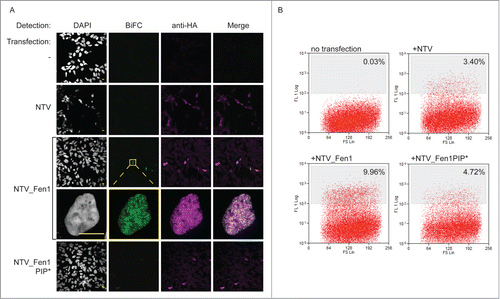
Figure 2. The BiFC approach reports on physiologically relevant protein interactions. (A) BiFC visualized by confocal microscopy. HEK293 cells stably expressing PCNA_CTV were transfected as indicated. Cells were processed for indirect immunofluorescence using a mouse anti-HA monoclonal primary antibody and goat anti-mouse Alexa Fluor 633 secondary antibody to detect the prey constructs (magenta) and BiFC signal was detected in the yellow channel, pseudo colored here in green. Bar = 10 µm. BiFC signal is specifically detected when the bait and prey constructs are able to interact. (B) BiFC detected by flow cytometry. PCNA_CTV expressing cells were transfected as indicated and yellow fluorescence monitored after 24 hours on a MoFlo cytometer. The percentage of cells above a threshold of 108 fluorescent units is indicated.

Figure 3. A library screen to identify PCNA interacting proteins. (A) The screen in practice. Top panels: FACS analysis of yellow fluorescence of HEK293 cells stably expressing PCNA_CTV 24 hours after transfection as indicated. The cells with a fluorescence level greater than 108 units (% indicated) were collected and returned to culture with selection to maintain the prey plasmids. Four weeks later the fluorescence profiles were as indicated (lower panels). (B) Validation of candidate PCNA interacting proteins from the screen. Constructs expressing the full length cloned cDNAs indicated were transfected into HEK293 cells stably expressing PCNA_CTV and BiFC signal was detected in the yellow channel using confocal microscopy.
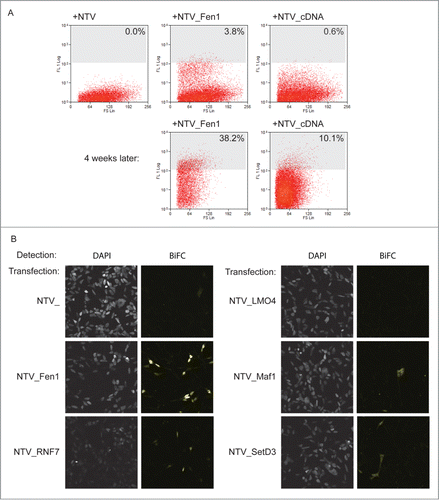
Figure 3. A library screen to identify PCNA interacting proteins. (A) The screen in practice. Top panels: FACS analysis of yellow fluorescence of HEK293 cells stably expressing PCNA_CTV 24 hours after transfection as indicated. The cells with a fluorescence level greater than 108 units (% indicated) were collected and returned to culture with selection to maintain the prey plasmids. Four weeks later the fluorescence profiles were as indicated (lower panels). (B) Validation of candidate PCNA interacting proteins from the screen. Constructs expressing the full length cloned cDNAs indicated were transfected into HEK293 cells stably expressing PCNA_CTV and BiFC signal was detected in the yellow channel using confocal microscopy.

Figure 4. Interaction between PCNA and the newly identified partners. (A) SetD3 interacts with PCNA. Soluble nuclease-treated protein extracts were made from MRC5 cells transfected as indicated. Immunoprecipitations were performed using an anti-PCNA polyclonal antibody (+) or a non-specific control IgG (−) and input material (i), unbound material (u) and immunoprecipitated material (b) was analyzed by western blotting using anti-V5 and anti-PCNA primary antibodies. (B) Maf1 interacts with PCNA. Immunoprecipitations were performed and analyzed as in A), using extracts from cells transfected with V5-Maf1 or controls as indicated. (C) Recombinant Maf1 interacts with PCNA. Recombinant His-HA-Maf1 and His-S-PCNA were individually expressed in E. coli. Soluble protein extracts were produced and mixed together or with control extracts (from cells expressing empty vectors or His-HA-GST) as indicated. His-S-PCNA was affinity purified on S-resin and the bound, and input, fractions analyzed by western blotting using anti-PCNA or anti-HA antibodies. (D) Recombinant RNF7 interacts with PCNA. Recombinant His-tagged RNF7 variants 1 (v1) or 4 (v4) and His-S-PCNA were individually expressed in E. coli. Extracts were produced and mixed together as in C). Proteins associated with S-resin were analyzed by western blotting using anti-His antibodies. In all parts the migration positions of protein molecular weight markers are indicated.
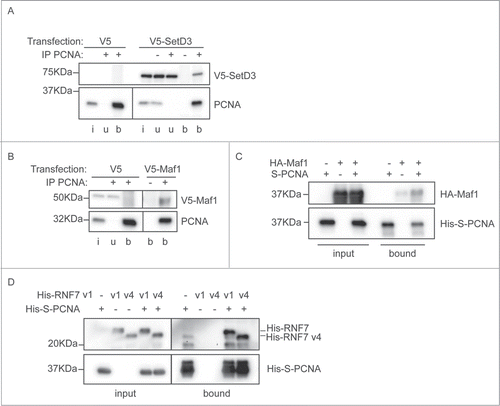
Figure 4. Interaction between PCNA and the newly identified partners. (A) SetD3 interacts with PCNA. Soluble nuclease-treated protein extracts were made from MRC5 cells transfected as indicated. Immunoprecipitations were performed using an anti-PCNA polyclonal antibody (+) or a non-specific control IgG (−) and input material (i), unbound material (u) and immunoprecipitated material (b) was analyzed by western blotting using anti-V5 and anti-PCNA primary antibodies. (B) Maf1 interacts with PCNA. Immunoprecipitations were performed and analyzed as in A), using extracts from cells transfected with V5-Maf1 or controls as indicated. (C) Recombinant Maf1 interacts with PCNA. Recombinant His-HA-Maf1 and His-S-PCNA were individually expressed in E. coli. Soluble protein extracts were produced and mixed together or with control extracts (from cells expressing empty vectors or His-HA-GST) as indicated. His-S-PCNA was affinity purified on S-resin and the bound, and input, fractions analyzed by western blotting using anti-PCNA or anti-HA antibodies. (D) Recombinant RNF7 interacts with PCNA. Recombinant His-tagged RNF7 variants 1 (v1) or 4 (v4) and His-S-PCNA were individually expressed in E. coli. Extracts were produced and mixed together as in C). Proteins associated with S-resin were analyzed by western blotting using anti-His antibodies. In all parts the migration positions of protein molecular weight markers are indicated.
Supplemental material

1053667_supplemental_files.zip

Download Zip (6 MB)